QGIS Maps
This uses the same data from the mapping practical - airbnbs and hotels (OSM) in London.
Ok, now we’re going to produce our map in QIGS.
8.20 Load data
Load QGIS, Open and Save a new project (Project > New)
Right click on
GeoPackageand create a new database to store our data in.gpkgLoad our data layers: London boroughs and OSM data (OSM data should be the
gis_osm_pois_a_free_1 polygon layer).Make sure the processing toolbox is active…go Plugins > Manage and Install Plugins > Installed (left side of the box that opens), Processing should be ticked….then select the cog that is in the toolbar — within the sqaure box in the image below.
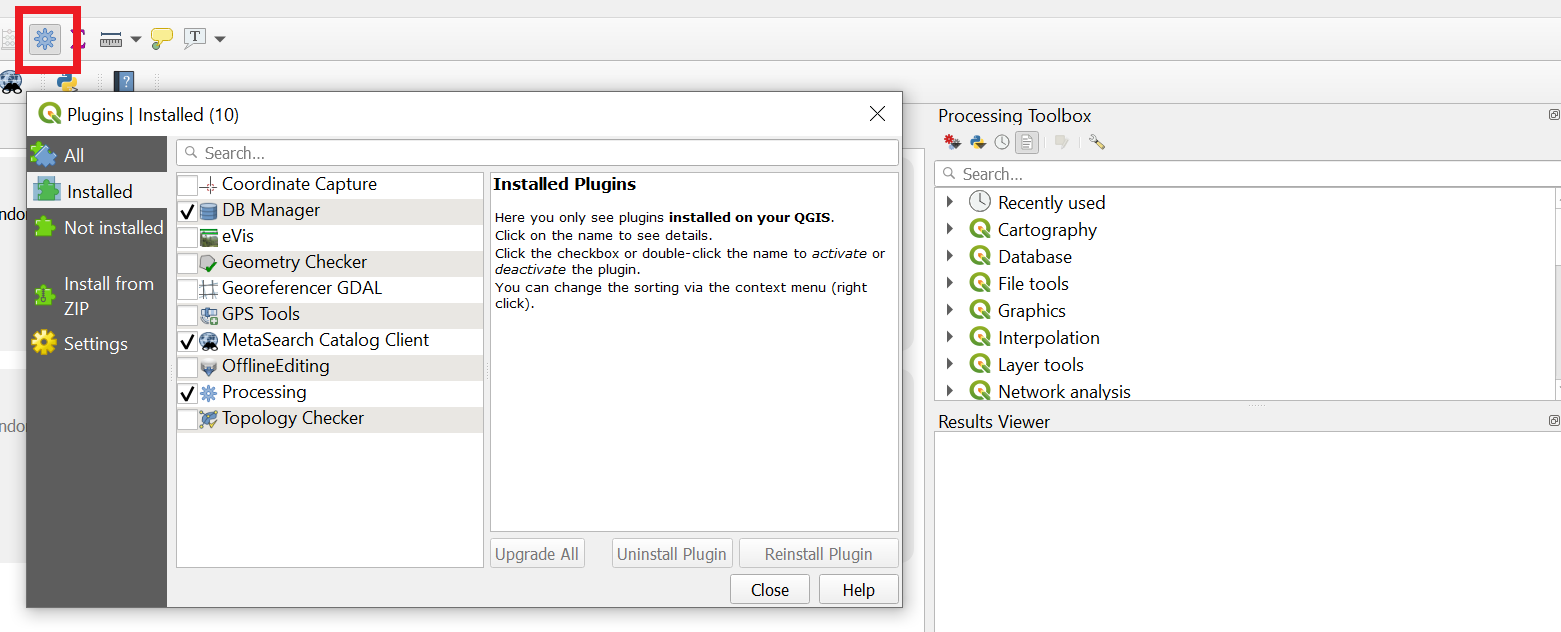
You can then search for tools in the Processing Toolbox that appears on the right of QGIS.
8.21 Manipulate data
If you recall from practical 1, QGIS sets the map document CRS to that of the first layer loaded. Our London boroughs layer is in British National Grid (EPSG: 27700) where as are OSM layers are in WGS 1984 (EPSG: 4326).
The OSM data will load and QGIS is pretty clever here as it will project ‘on the fly’ which means it can display the data stored in one projection as if it were in another, but the actual data is not altered. This is both good and bad. Good as it let’s us visualise our data quickly, but bad because if we have data with different projections you will run into problems during processing. My advice is to load the data and pick a projection to do all processing in.
- Reproject the OSM data. If you scroll right in the dialogue box you’ll be able to save it into your
GeoPackage. You might need to refresh the browers to see the layer.
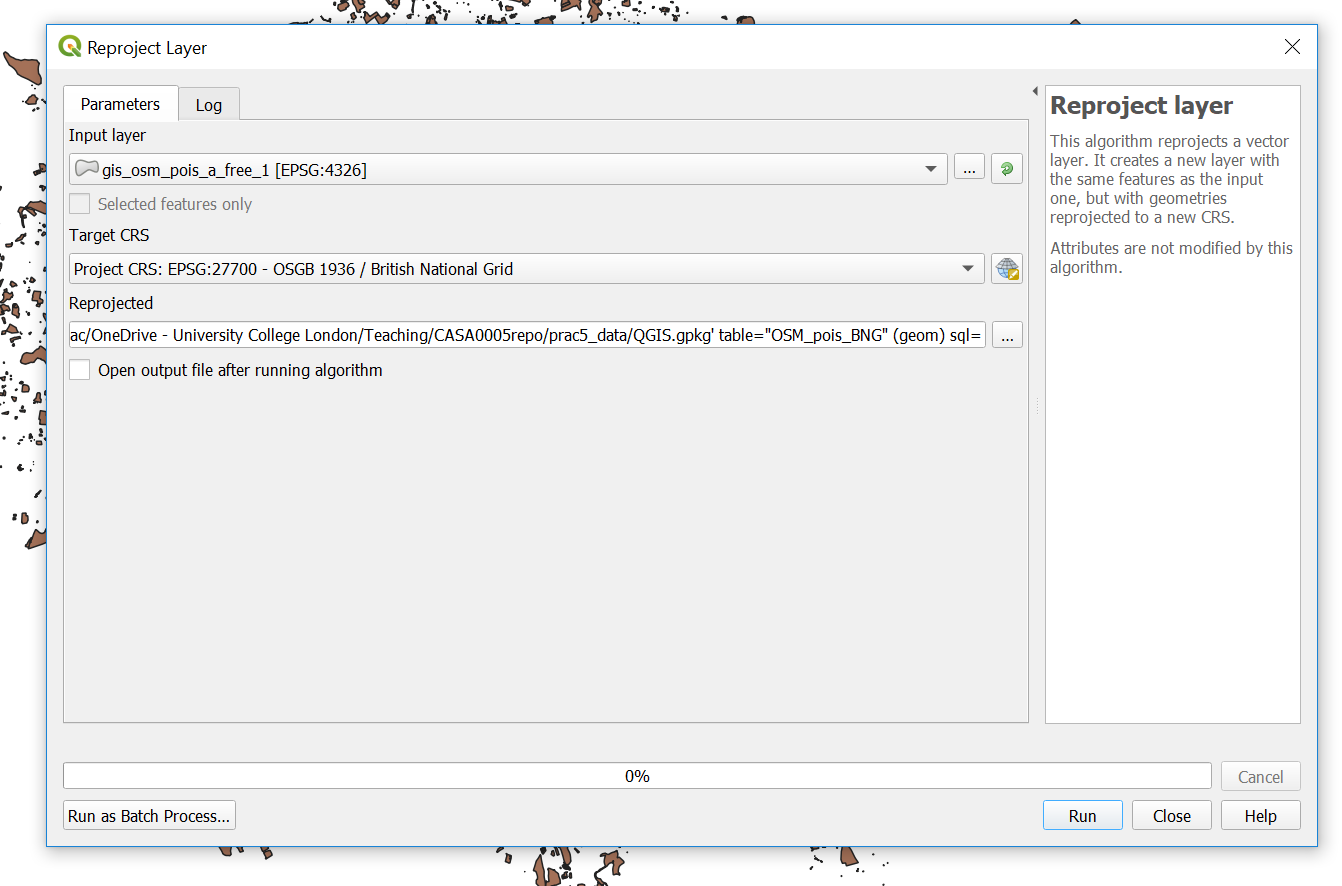
While we are working with projections…check the CRS of your map (bottom right)…mine is EPSG 4326 (WGS 1984) and we want it to be in British National Grid (which is ESPG: 27700), click on it, change it and apply.
For completness also drag and drop your London boroughs
.shpfrom the Layers window (bottom left) into yourGeoPacakge. Remove the old one from the Layers window. Double click on the newLondon boroughslayer in theGeoPackageand it will openTo get only the hotels out of our OSM data we can use
extract by attrbitue…this is my tool dialogue box. You can find extract by attribute by clicking the toolbox cog, then searching for extract by attribute.
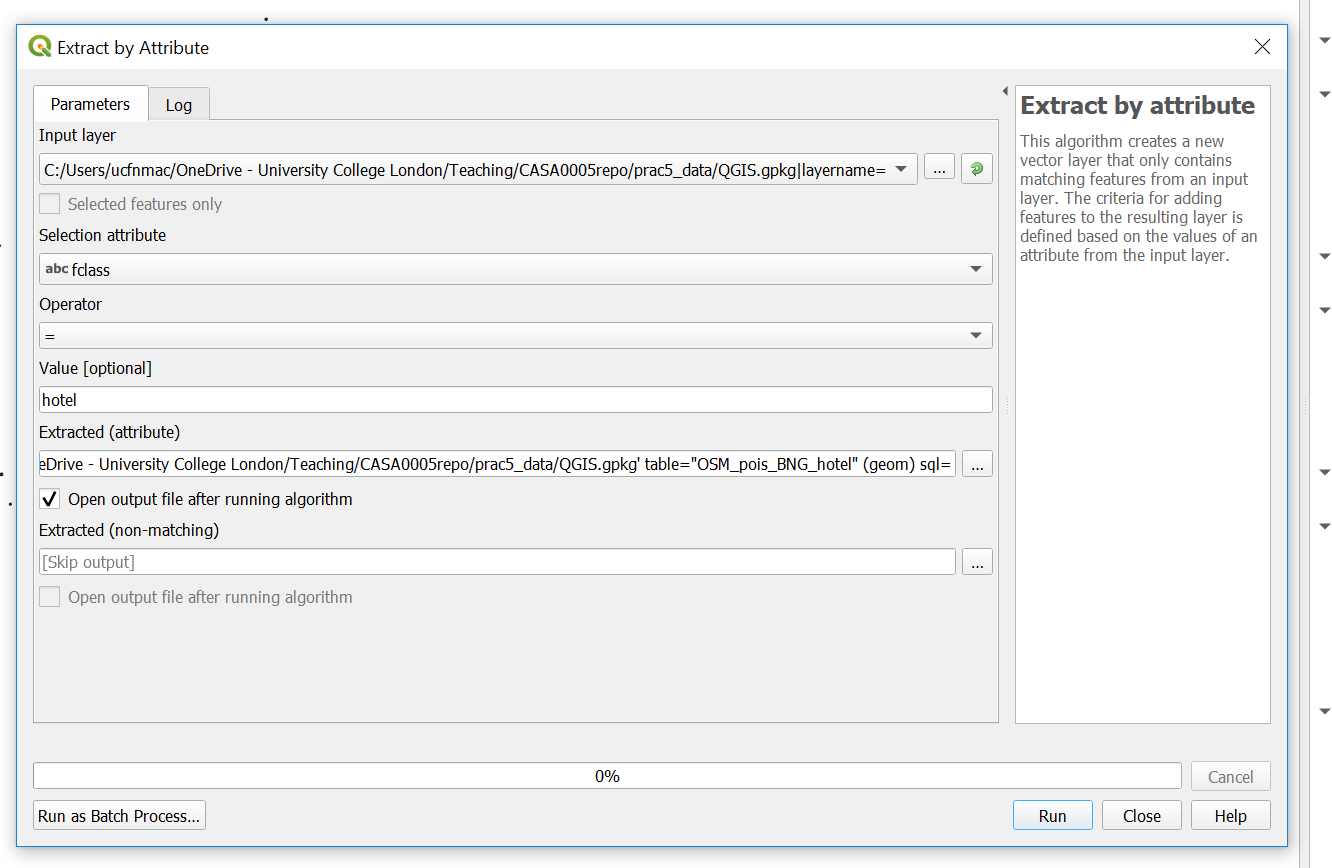
Refresh the browser —you have to do this everytime. Double click the layer to load it.
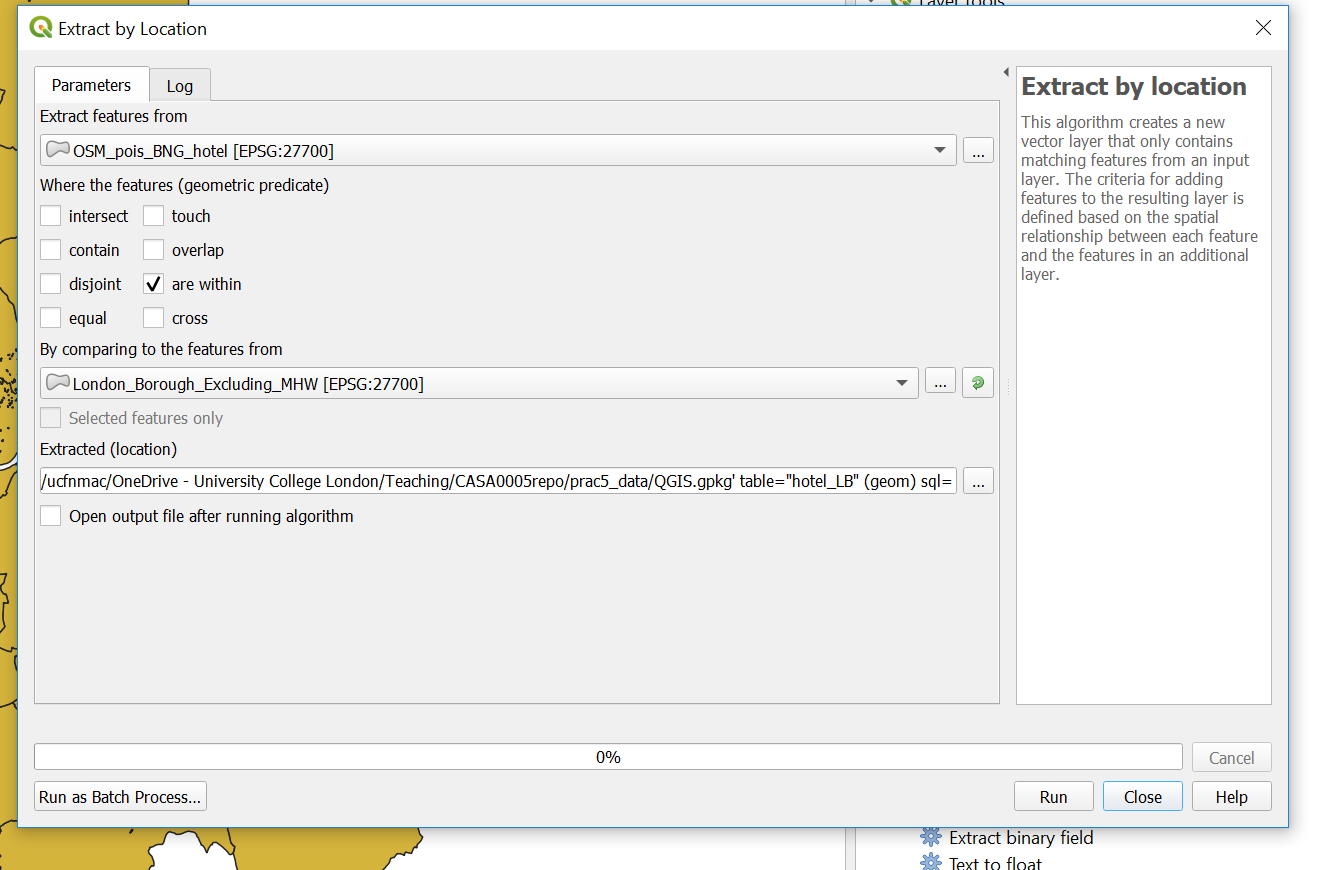
Now
extract by location usingthe file you just created and the London boroughs (so hotels within the London boroughs). Note that i selected that the hotels are within the Lonon boroughs
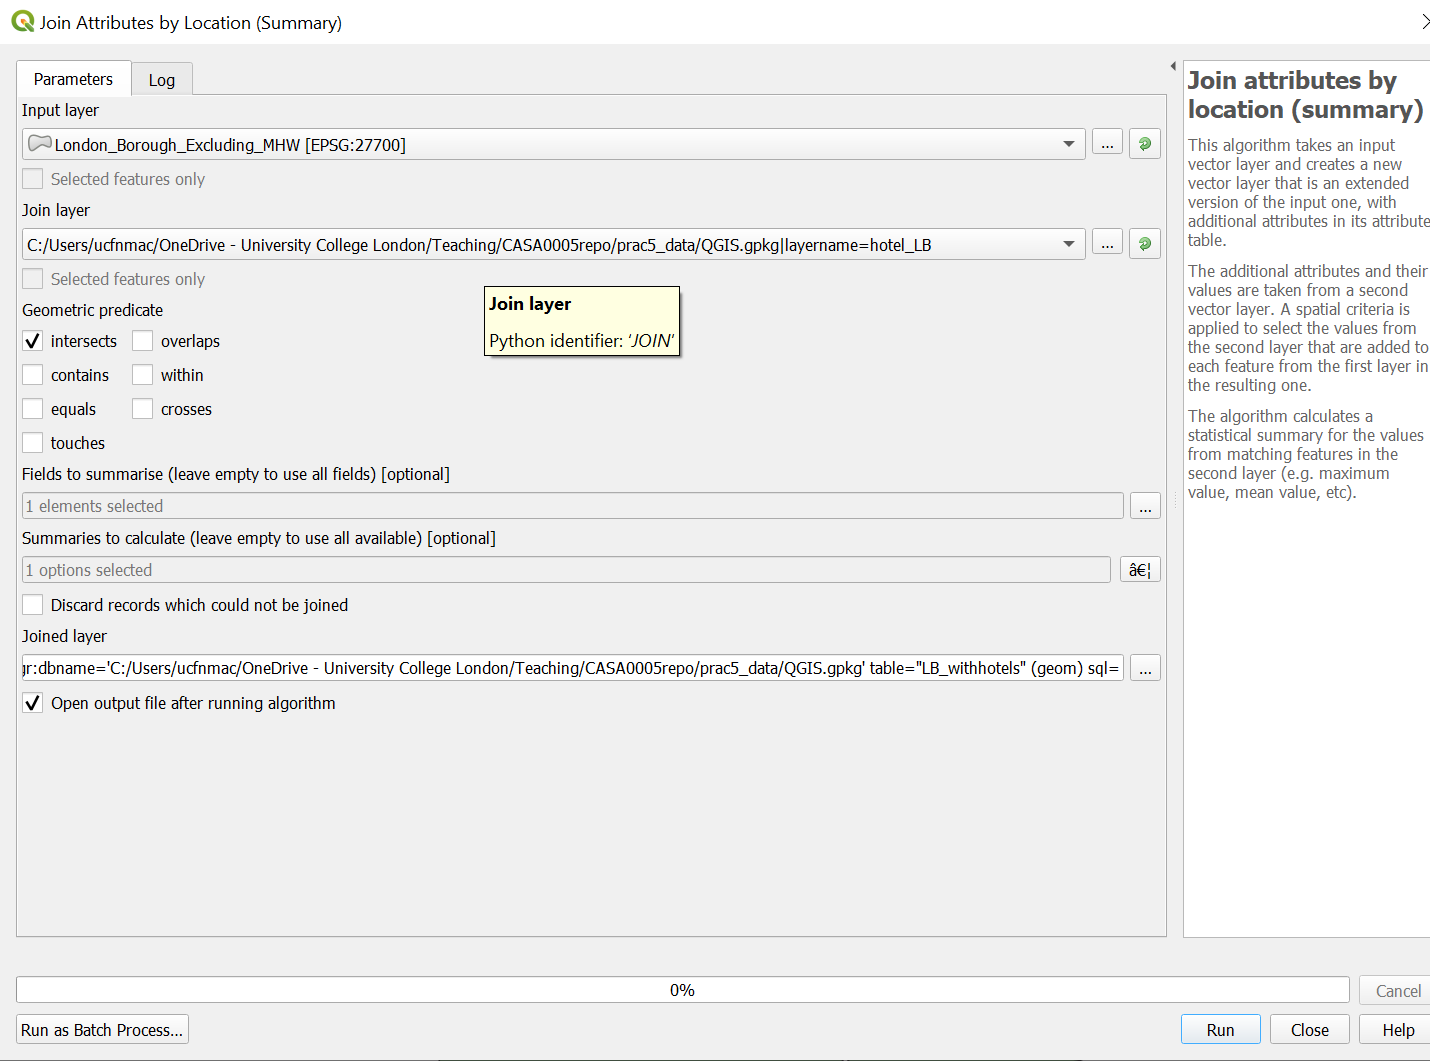
- Let’s now count our hotels per London borough using
Join Attributes by Location (Summary). Note i selected theosm_idfield to summarise using count in summaries to calcualte….
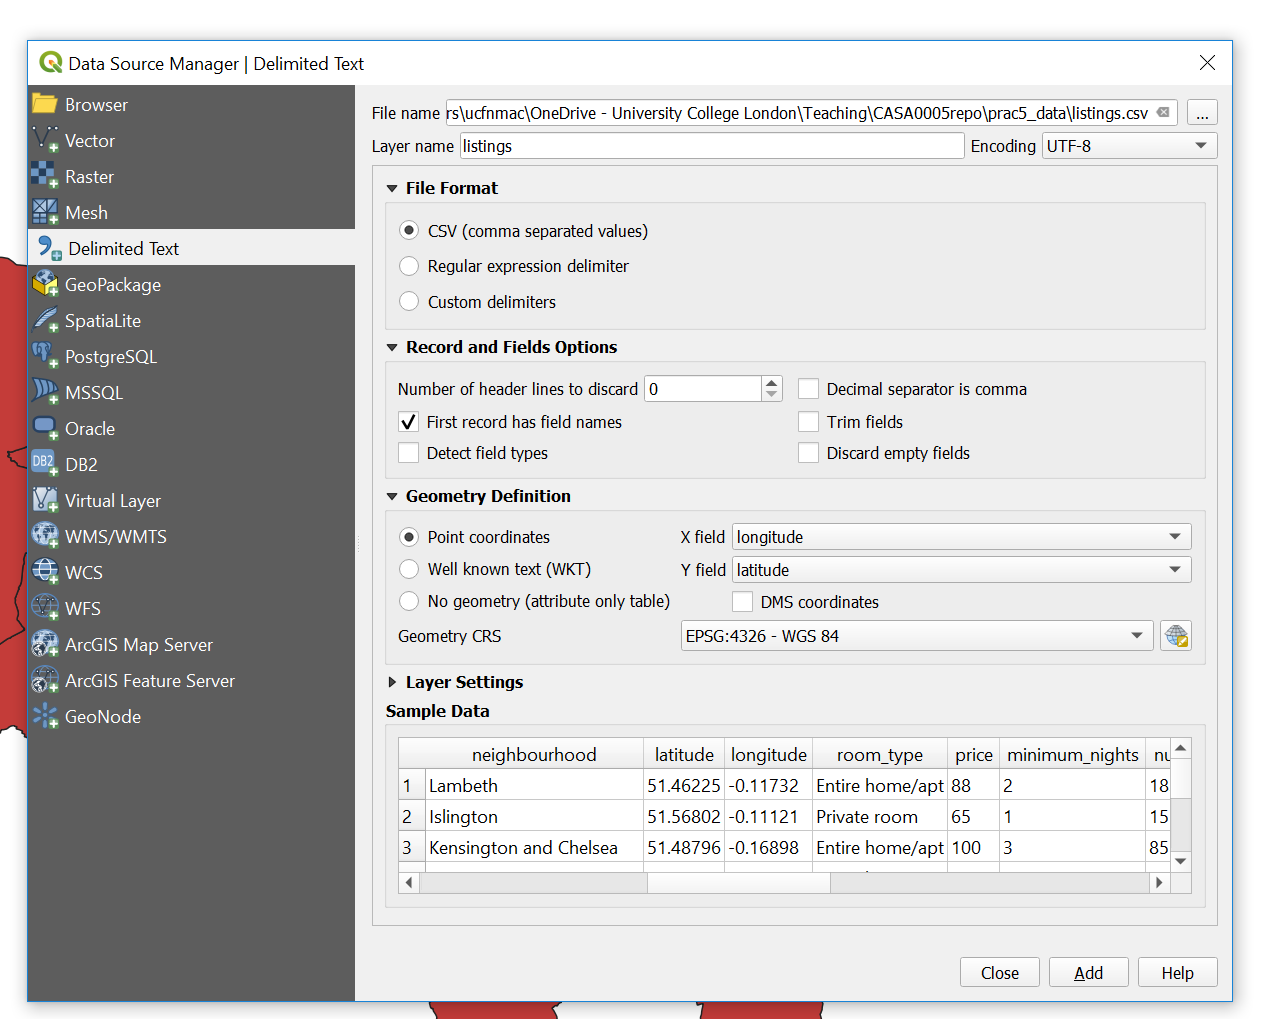
- Next up is the Air b n b data, i’ll show you how to load it then you need to produce a count of rentals per London borough using the same rules as before (entire place/apartment and available all year). To load the data click Data Source Manager > Delimited Text:
You need to:
Sort the projection out and save into your
.gpkgSelect by attibute (entire place and 365 days)
Select by location (within London boroughs)
Join the output to a new (or original) London borough polygon layer
Note You can filter by multiple attributes using extract by expression…here we would use the expression
("room_type" ILIKE '%Entire home/apt%') AND ("availability_365" ILIKE '%365%')to filter based on entire home/apt and available 365 days of the year.
8.22 Map data
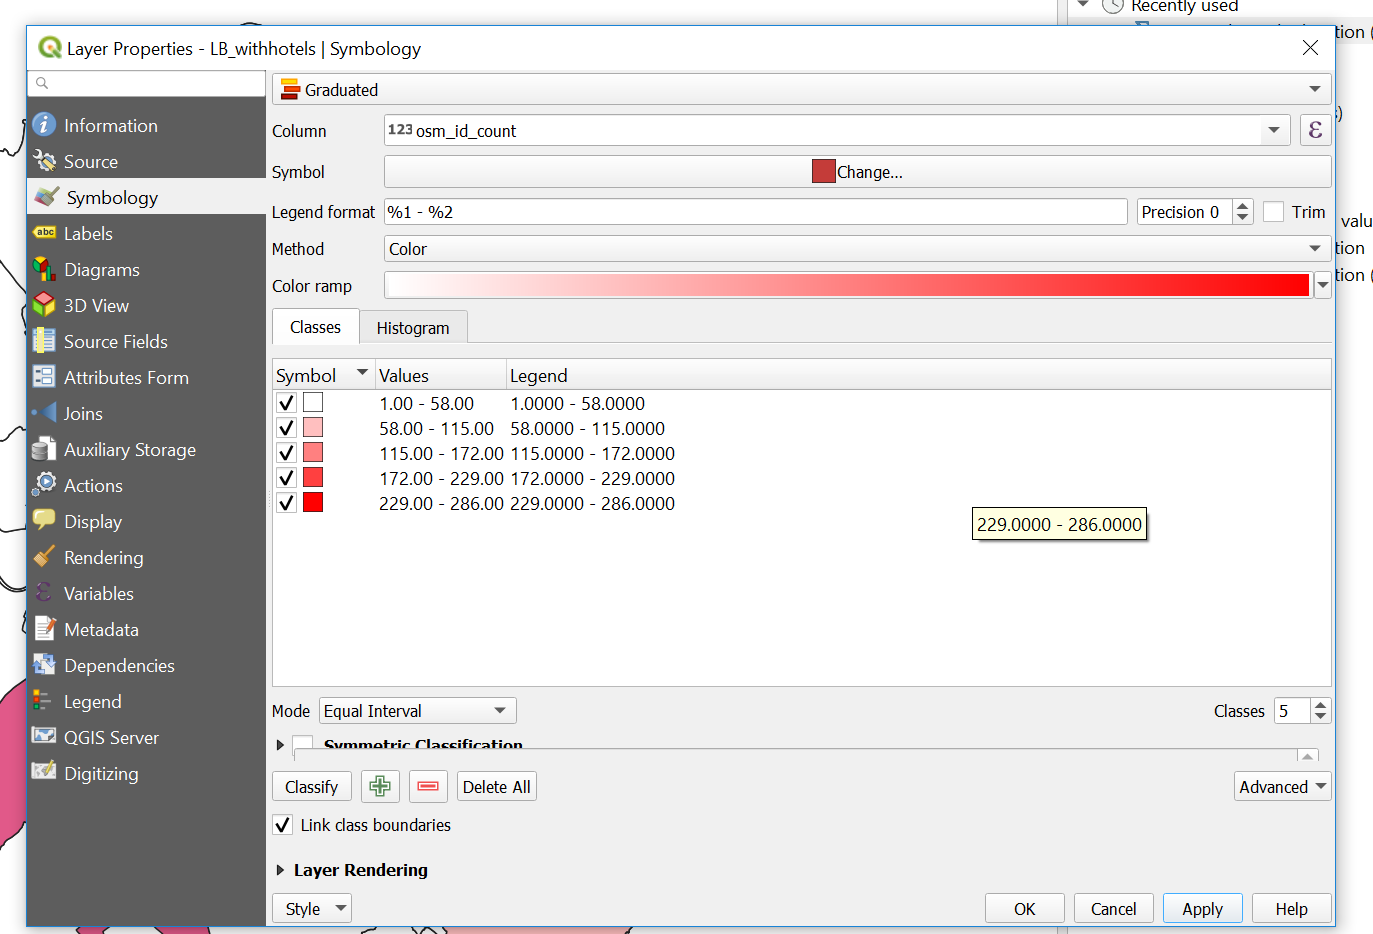
- So now you should have two London borough layers one with a count of all the hotels and the other with a count of all the air b n b properties…To make a thematic map right click on the hotel layer > Symbology (tab) select Graduated and your count coloumn as the coloumn, mode as natural breaks and then classify…
Now save the style so we can use it on our other layer….Style > Save Style > select in Database and provide a name
Go to the symbology of the other layer > select Graduated, select the correct count coloumn, then Style > Load Style, from database and your saved style should be listed.
To create a new map document in QGIS go: Project > New Print Layout. The layout works by adding a new map which is a snapshop of the main QGIS document….
In the main QGIS document only select your airbnb layer, right click and zoom to it. GO back to the Print Layout > Add Item > Add Map..draw a sqaure…the layer should appear…In the window at the bottom right under Item Properties select to Lock layers…so now if you were to unselect that layer it would still remain on in the Print Layout
Go back to your main QGIS document, now only select the hotels layer…repeat the Add Map steps and lock the layers
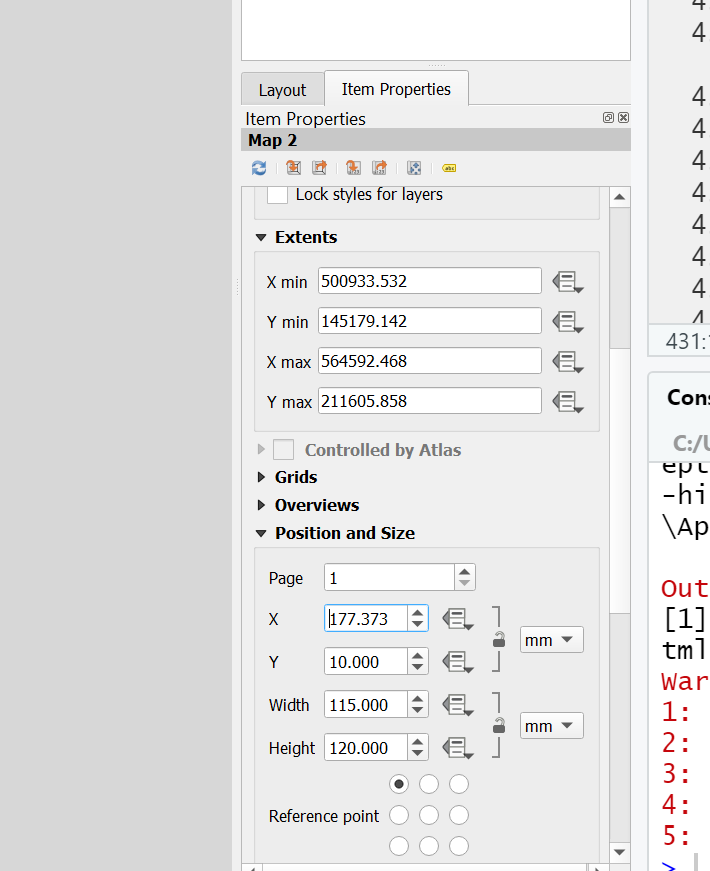
Make sure you give the same size to both Maps…to do so click on a Map > Item Properties (bottom right) scroll down, expand Position and Size, give the same width and height values
Add some guides to line everything up go: View > Manage Guides. The guides panel will appear in the bottom right hand corner, click the + to add a guide at a distance you specify. You can then drag your maps to snap to the guides.
Add a scale bar: Add Item > Add Scale Bar. To adjust it, right click > Item Properties…alter some of the properties to make it look appropraite.
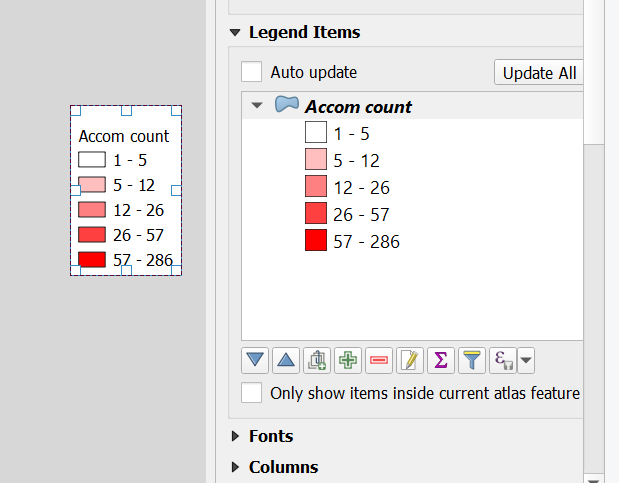
Add a legend: Add Item > Add Legend and draw a sqaure. Same process to adjust it. Untick Auto update then you can use the
+and-icons to remove items along with the edit icon to change the text…this is what mine looks like…
Add an arrow: Add Item > Add Arrow, left click to start (twice) and right click to finish.
Add text: In the left hand tool bar click add text box and draw a square
Let’s add our extent map, load the UK
.shp, reproject it and save it into your.gpkg. Do the same for your city points but be sure to load them into your.gpkgbefore you run any tool (just drag and drop them). When reprojecting you might see a lot of errors for certain points in the processing box…don’t worryBritish National Gridonly covers the UK — these errors will be for points outside of the UK which we will removeNow replicate our ArcMap inset map by opening the Layer Properties of the new cities layer > Labels > Single Labels with city name, alter any of the text styles as you wish. Also play around with the symbology..
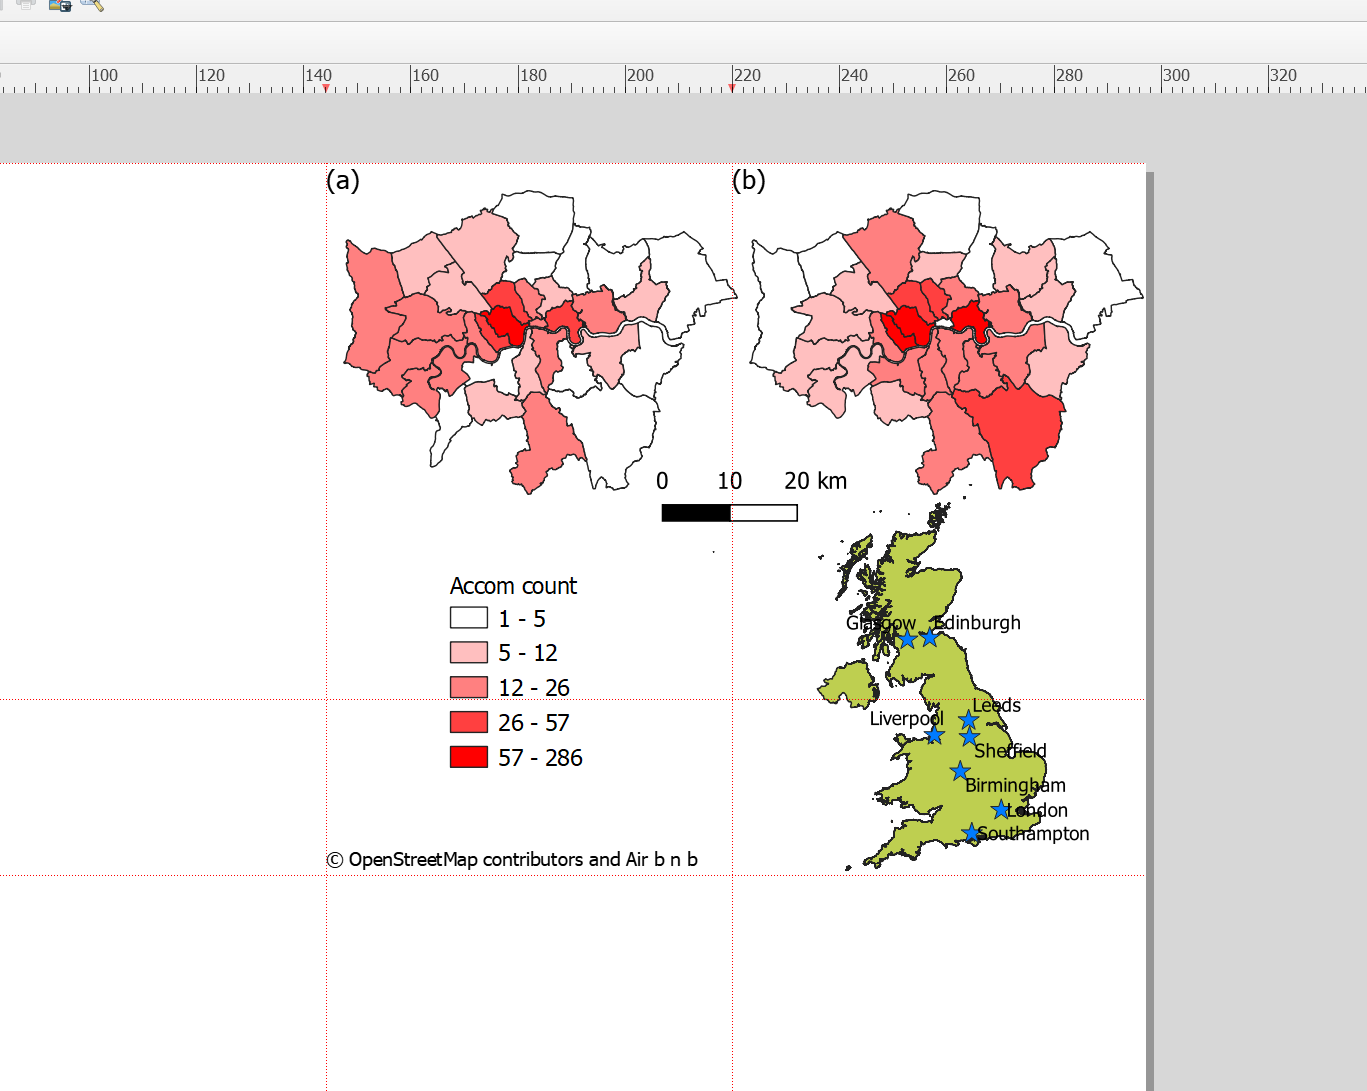
Add the new map into your map layout and move the items to appropraite locations…
This is what i came up with in my map layout
8.23 Export map
To export your map to a file go: Layout > Export as Image and select crop to content…and here is my map…
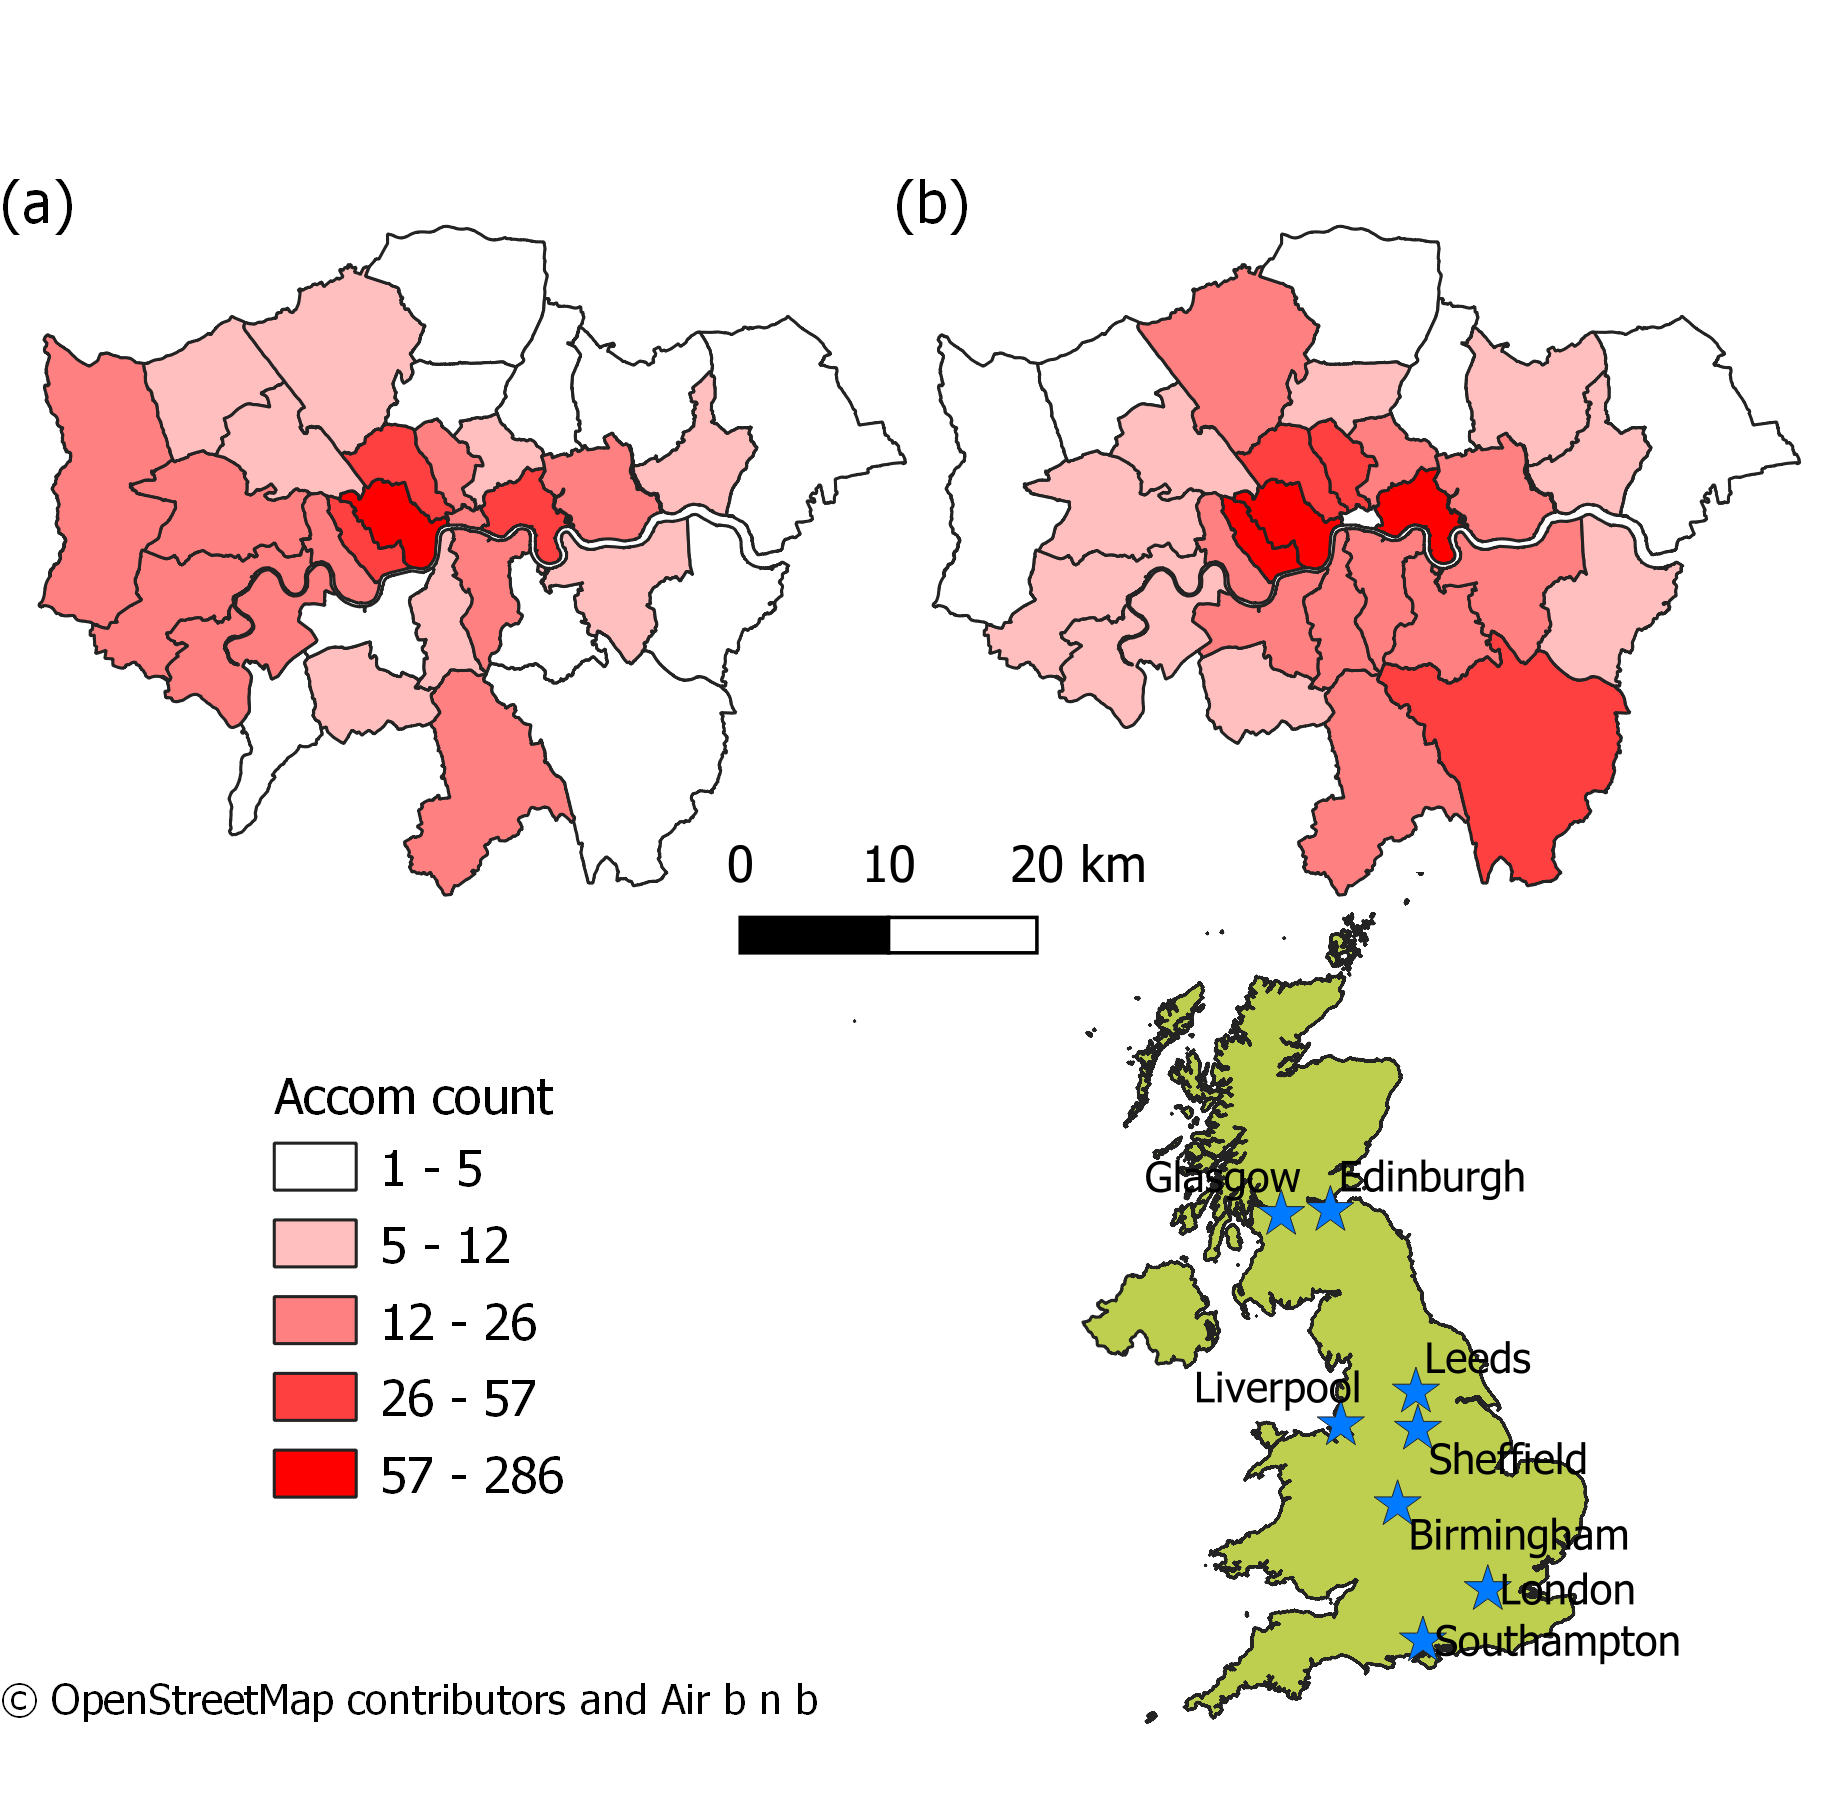
Note there are a few problems with my map that could be improved: (1) If you look closely at the vector layer for London you will see that one of the boroughs is missing from map (b) — this is most likely because it has no data (0) but could easily be fixed. We will see this later on in R! (2) Whilst this time i’ve displayed all the city names the colour scheme needs work…for ideas on this check out colour brewer.
8.24 Graphical modeler
As in ArcMap we can automate the methodological process in QGIS using the graphical modeler..again i’ll provide a short example here
- Go: Processing > Graphical Modeler
Graphical modeler is a bit different to model builder in ArcMap, here you drag inputs and algorthims from the inputs box (bottom left) into the model, you don’t need to specify the inputs here. When you click the run buttom (play on the top toolbar) you’ll be asked to provide the layers for the inputs. The options will be limited to those you currently have open in your map…check out the model i made to automate reprojecting cities and the UK outline, then extracting the cities within the UK outline…
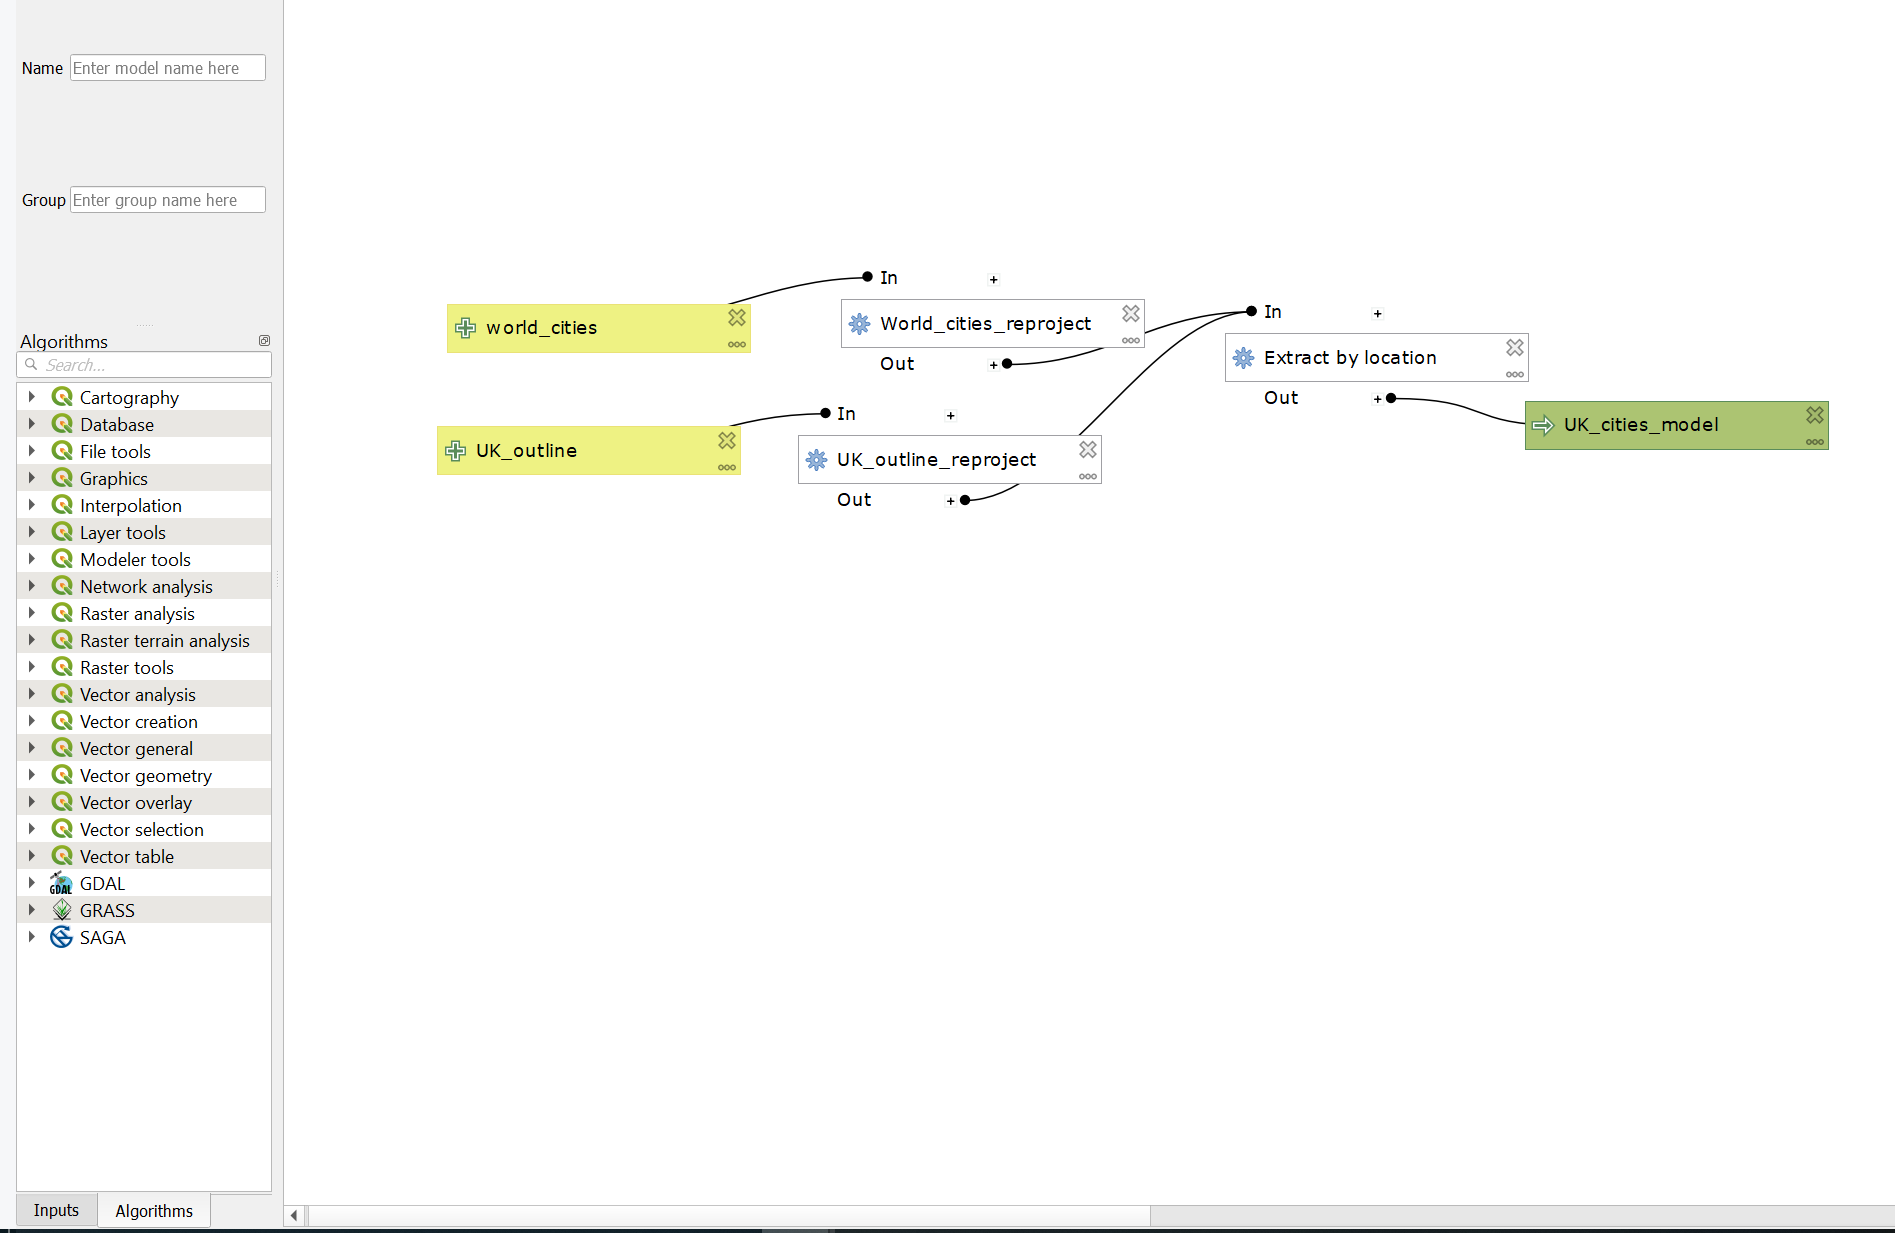
Make sure you save your model from the top tool bar either as a standalone model or within your project