#Load relevant packages
library(dplyr)
library(tidyverse)
library(janitor)
library(RColorBrewer)
library(ggplot2) #for graphs
library(tmap) #for maps
library(tmaptools) #for maps
library(leaflet) #for maps
library(reader)
library(readxl)
library(data.table)
library(knitr)
library(sp)
library(sf)
library(spdep)
library(spatstat)
library(PostcodesioR) #for postcode lat and long
library(mosaic) #for favstats function
library(geodist) #for distances
library(rje) #for row mins
library(osmdata) #for osm
library(osmextract) # for osm
library(osrm) #for osm
library(r5r) #for public transport
library(tidygeocoder)
library(tidytransit) #for public transport5 Food bank accessibility
Note
Aim: Identify areas (in and around Oxford/shire) with low access and high demand for food banks
- Convert food bank addresses to point locations
- Create maps/visualisations of locations of food banks (in the UK and Oxfordshire)
- Calculate accessibility for walking, driving, and public transport using r5r package
- Identify areas with low accessibility to food banks, but a perceived high need (based on a couple of factors)
Note
Optional reading
- Pereira, R. et al., r5r: Rapid Realistic Routing on Multimodal Transport Networks with R5 in R (2021)
- Allen, J. and Farber, S. Changes in transit accessibility to food banks in Toronto during Covid-19 (2021)
- Higgins, C.D. et al. Changes in accessibility to emergency and community food services during Covid-19 and implications for low income populations in Hamilton, Ontario (2021)
5.1 Convert food bank addresses to point locations
Firstly, load the R packages needed for the practical. You may need to install some of these for the first time.
5.1.1 Load the spatial data
We need to load the spatial data for different spatial scales. This polygons data will be used for creating maps and calculating accessibility to food banks centres. These were downloaded from the Open Geography Portal (from the Office for National Statistics).
- Lower super output area (LSOA) scale
- Local authority scale
- Entire country scale
There are 35,672 LSOAs (for England and Wales)
#2021 shape file for LSOAs
LSOA_2021 <- st_read("prac5_data/LSOA_2021/LSOA_(Dec_2021)_Boundaries_Generalised_Clipped_EW_(BGC).shp") %>%
  st_transform(., 27700) %>%
  clean_names()
Reading layer `LSOA_(Dec_2021)_Boundaries_Generalised_Clipped_EW_(BGC)' from data source `C:\Users\Andy\OneDrive - University College London\Teaching\Guest\Oxford_25\spatial analysis of public health\spatial-analysis-of-public-health-data-25\prac5_data\LSOA_2021\LSOA_(Dec_2021)_Boundaries_Generalised_Clipped_EW_(BGC).shp'
using driver `ESRI Shapefile'
Simple feature collection with 35672 features and 6 fields
Geometry type: MULTIPOLYGON
Dimension: XY
Bounding box: xmin: 82668.52 ymin: 5352.6 xmax: 655653.8 ymax: 657539.4
Projected CRS: OSGB36 / British National GridThere are 374 local authorities (for the UK)
#2022 shape file for LAs
LA_2022 <- st_read("prac5_data/LA_2022/LAD_MAY_2022_UK_BFE_V3.shp") %>%
  st_transform(., 27700) %>%
  clean_names()
Reading layer `LAD_MAY_2022_UK_BFE_V3' from data source
`C:\Users\Andy\OneDrive - University College London\Teaching\Guest\Oxford_25\spatial analysis of public health\spatial-analysis-of-public-health-data-25\prac5_data\LA_2022\LAD_MAY_2022_UK_BFE_V3.shp'
using driver `ESRI Shapefile'
Simple feature collection with 374 features and 7 fields
Geometry type: MULTIPOLYGON
Dimension: XY
Bounding box: xmin: -116.1928 ymin: 5333.81 xmax: 655989 ymax: 1220310
Projected CRS: OSGB36 / British National Grid#2023 shape file for UK
UK_border <- st_read("prac5_data/UK_2023/CTRY_DEC_2023_UK_BUC.shp") %>%
st_transform(., 27700) %>%
clean_names() Reading layer `CTRY_DEC_2023_UK_BUC' from data source
`C:\Users\Andy\OneDrive - University College London\Teaching\Guest\Oxford_25\spatial analysis of public health\spatial-analysis-of-public-health-data-25\prac5_data\UK_2023\CTRY_DEC_2023_UK_BUC.shp'
using driver `ESRI Shapefile'
Simple feature collection with 4 features and 8 fields
Geometry type: MULTIPOLYGON
Dimension: XY
Bounding box: xmin: -116.1928 ymin: 7054.1 xmax: 655653.8 ymax: 1220310
Projected CRS: OSGB36 / British National Grid5.1.2 Data on Trussell food bank centres
Next, we load the Trussell food bank data with addresses (this data was provided by Trussell in February 2023 so some centres may have closed in the last two years or new centres may have opened).
#locations of food banks from TT
TT_foodbanks <- read_excel("prac5_data/Food banks Feb23.xlsx") %>%
  clean_names()
In order to derive point locations from postcodes, we need to clean the food bank postcodes so they are in a uniform and readable form. At this stage, we also remove food bank centres that are not currently open or are warehouses or offices (where people cannot collect food from).
#removing white space from postcodes
TT_foodbanks$postcode <- gsub("[[:space:]]", "", TT_foodbanks$postcode)

#filter out only distribution centres
TT_foodbanks <- TT_foodbanks %>%
  filter(type == "Distribution Centre") %>% #only want distribution centres and not warehouses or offices
  filter(operating_model != "Temporarily Closed") #remove centres that are currently closed
Next, we derive the point locations from postcodes. Unfortunately, the approach below only allows 100 locations at a time to be converted.
The function lapply used in these code chunks applies a function over a list or vector. We are applying it to a list of postcodes.
TT_foodbanks1 <- TT_foodbanks[1:100, ]

#make postcodes into a list
list <- as.list(unique(TT_foodbanks1$postcode))

#foodbank locations
#lat and long from postcodes
pc_list <- list(postcodes = list)
bulk_lookup_result <- bulk_postcode_lookup(pc_list)
str(bulk_lookup_result[1])
List of 1
$ :List of 2
..$ query : chr "KT190JG"
..$ result:List of 27
.. ..$ postcode : chr "KT19 0JG"
.. ..$ quality : int 1
.. ..$ eastings : int 520624
.. ..$ northings : int 164193
.. ..$ country : chr "England"
.. ..$ nhs_ha : chr "South East Coast"
.. ..$ longitude : num -0.269
.. ..$ latitude : num 51.4
.. ..$ european_electoral_region : chr "South East"
.. ..$ primary_care_trust : chr "Surrey"
.. ..$ region : chr "South East"
.. ..$ lsoa : chr "Epsom and Ewell 002A"
.. ..$ msoa : chr "Epsom and Ewell 002"
.. ..$ incode : chr "0JG"
.. ..$ outcode : chr "KT19"
.. ..$ parliamentary_constituency : chr "Epsom and Ewell"
.. ..$ parliamentary_constituency_2024: chr "Epsom and Ewell"
.. ..$ admin_district : chr "Epsom and Ewell"
.. ..$ parish : chr "Epsom and Ewell, unparished area"
.. ..$ admin_county : chr "Surrey"
.. ..$ date_of_introduction : chr "198001"
.. ..$ admin_ward : chr "Ewell Court"
.. ..$ ced : chr "Ewell Court, Auriol and Cuddington"
.. ..$ ccg : chr "NHS Surrey Heartlands"
.. ..$ nuts : chr "Epsom and Ewell"
.. ..$ pfa : chr "Surrey"
.. ..$ codes :List of 14
.. .. ..$ admin_district : chr "E07000208"
.. .. ..$ admin_county : chr "E10000030"
.. .. ..$ admin_ward : chr "E05015097"
.. .. ..$ parish : chr "E43000137"
.. .. ..$ parliamentary_constituency : chr "E14001227"
.. .. ..$ parliamentary_constituency_2024: chr "E14001227"
.. .. ..$ ccg : chr "E38000264"
.. .. ..$ ccg_id : chr "92A"
.. .. ..$ ced : chr "E58001483"
.. .. ..$ nuts : chr "TLJ26"
.. .. ..$ lsoa : chr "E01030394"
.. .. ..$ msoa : chr "E02006336"
.. .. ..$ lau2 : chr "E07000208"
.. .. ..$ pfa : chr "E23000031"#postcode look up
bulk_list <- lapply(bulk_lookup_result, "[[", 2)
TT_foodbank_location_points1 <-
map_dfr(bulk_list,
`[`,
c("postcode", "longitude", "latitude"))
#as spatial points
TT_foodbank_location_points1 <-
st_as_sf(TT_foodbank_location_points1,
coords = c("longitude", "latitude"), crs = 4326)TT_foodbanks2 <- TT_foodbanks[101:200, ]
#make postcodes into a list
list <- as.list(unique(TT_foodbanks2$postcode))
#foodbank locations
#lat and long from postcodes
pc_list <- list(postcodes = list)
bulk_lookup_result <- bulk_postcode_lookup(pc_list)
str(bulk_lookup_result[1])List of 1
$ :List of 2
..$ query : chr "LA231DY"
..$ result:List of 27
.. ..$ postcode : chr "LA23 1DY"
.. ..$ quality : int 1
.. ..$ eastings : int 341211
.. ..$ northings : int 498535
.. ..$ country : chr "England"
.. ..$ nhs_ha : chr "North West"
.. ..$ longitude : num -2.91
.. ..$ latitude : num 54.4
.. ..$ european_electoral_region : chr "North West"
.. ..$ primary_care_trust : chr "Cumbria Teaching"
.. ..$ region : chr "North West"
.. ..$ lsoa : chr "South Lakeland 001D"
.. ..$ msoa : chr "South Lakeland 001"
.. ..$ incode : chr "1DY"
.. ..$ outcode : chr "LA23"
.. ..$ parliamentary_constituency : chr "Westmorland and Lonsdale"
.. ..$ parliamentary_constituency_2024: chr "Westmorland and Lonsdale"
.. ..$ admin_district : chr "Westmorland and Furness"
.. ..$ parish : chr "Windermere"
.. ..$ admin_county : NULL
.. ..$ date_of_introduction : chr "198001"
.. ..$ admin_ward : chr "Windermere and Ambleside"
.. ..$ ced : chr "Windermere"
.. ..$ ccg : chr "NHS Lancashire and South Cumbria"
.. ..$ nuts : chr "South Lakeland"
.. ..$ pfa : chr "Cumbria"
.. ..$ codes :List of 14
.. .. ..$ admin_district : chr "E06000064"
.. .. ..$ admin_county : chr "E99999999"
.. .. ..$ admin_ward : chr "E05014249"
.. .. ..$ parish : chr "E04002661"
.. .. ..$ parliamentary_constituency : chr "E14001580"
.. .. ..$ parliamentary_constituency_2024: chr "E14001580"
.. .. ..$ ccg : chr "E38000228"
.. .. ..$ ccg_id : chr "01K"
.. .. ..$ ced : chr "E58000191"
.. .. ..$ nuts : chr "TLD12"
.. .. ..$ lsoa : chr "E01019395"
.. .. ..$ msoa : chr "E02004015"
.. .. ..$ lau2 : chr "E07000031"
.. .. ..$ pfa : chr "E23000002"#postcode look up
bulk_list <- lapply(bulk_lookup_result, "[[", 2)
TT_foodbank_location_points2 <-
map_dfr(bulk_list,
`[`,
c("postcode", "longitude", "latitude"))
#as spatial points
TT_foodbank_location_points2 <-
st_as_sf(TT_foodbank_location_points2,
coords = c("longitude", "latitude"), crs = 4326)TT_foodbanks3 <- TT_foodbanks[201:300, ]
#make postcodes into a list
list <- as.list(unique(TT_foodbanks3$postcode))
#foodbank locations
#lat and long from postcodes
pc_list <- list(postcodes = list)
bulk_lookup_result <- bulk_postcode_lookup(pc_list)
str(bulk_lookup_result[1])List of 1
$ :List of 2
..$ query : chr "CB259HR"
..$ result:List of 27
.. ..$ postcode : chr "CB25 9HR"
.. ..$ quality : int 1
.. ..$ eastings : int 549616
.. ..$ northings : int 265265
.. ..$ country : chr "England"
.. ..$ nhs_ha : chr "East of England"
.. ..$ longitude : num 0.191
.. ..$ latitude : num 52.3
.. ..$ european_electoral_region : chr "Eastern"
.. ..$ primary_care_trust : chr "Cambridgeshire"
.. ..$ region : chr "East of England"
.. ..$ lsoa : chr "South Cambridgeshire 004C"
.. ..$ msoa : chr "South Cambridgeshire 004"
.. ..$ incode : chr "9HR"
.. ..$ outcode : chr "CB25"
.. ..$ parliamentary_constituency : chr "Ely and East Cambridgeshire"
.. ..$ parliamentary_constituency_2024: chr "Ely and East Cambridgeshire"
.. ..$ admin_district : chr "South Cambridgeshire"
.. ..$ parish : chr "Waterbeach"
.. ..$ admin_county : chr "Cambridgeshire"
.. ..$ date_of_introduction : chr "200609"
.. ..$ admin_ward : chr "Milton & Waterbeach"
.. ..$ ced : chr "Waterbeach"
.. ..$ ccg : chr "NHS Cambridgeshire and Peterborough"
.. ..$ nuts : chr "South Cambridgeshire"
.. ..$ pfa : chr "Cambridgeshire"
.. ..$ codes :List of 14
.. .. ..$ admin_district : chr "E07000012"
.. .. ..$ admin_county : chr "E10000003"
.. .. ..$ admin_ward : chr "E05011301"
.. .. ..$ parish : chr "E04001848"
.. .. ..$ parliamentary_constituency : chr "E14001224"
.. .. ..$ parliamentary_constituency_2024: chr "E14001224"
.. .. ..$ ccg : chr "E38000260"
.. .. ..$ ccg_id : chr "06H"
.. .. ..$ ced : chr "E58000102"
.. .. ..$ nuts : chr "TLH12"
.. .. ..$ lsoa : chr "E01018300"
.. .. ..$ msoa : chr "E02003778"
.. .. ..$ lau2 : chr "E07000012"
.. .. ..$ pfa : chr "E23000023"#postcode look up
bulk_list <- lapply(bulk_lookup_result, "[[", 2)
TT_foodbank_location_points3 <-
map_dfr(bulk_list,
`[`,
c("postcode", "longitude", "latitude"))
#as spatial points
TT_foodbank_location_points3 <-
st_as_sf(TT_foodbank_location_points3,
coords = c("longitude", "latitude"), crs = 4326)TT_foodbanks4 <- TT_foodbanks[301:400, ]
#make postcodes into a list
list <- as.list(unique(TT_foodbanks4$postcode))
#foodbank locations
#lat and long from postcodes
pc_list <- list(postcodes = list)
bulk_lookup_result <- bulk_postcode_lookup(pc_list)
str(bulk_lookup_result[1])List of 1
$ :List of 2
..$ query : chr "IV191AL"
..$ result:List of 27
.. ..$ postcode : chr "IV19 1AL"
.. ..$ quality : int 1
.. ..$ eastings : int 277951
.. ..$ northings : int 882070
.. ..$ country : chr "Scotland"
.. ..$ nhs_ha : chr "Highland"
.. ..$ longitude : num -4.06
.. ..$ latitude : num 57.8
.. ..$ european_electoral_region : chr "Scotland"
.. ..$ primary_care_trust : chr "Highland Health and Social Care Partnership"
.. ..$ region : NULL
.. ..$ lsoa : chr "Tain - 04"
.. ..$ msoa : chr "Tain"
.. ..$ incode : chr "1AL"
.. ..$ outcode : chr "IV19"
.. ..$ parliamentary_constituency : chr "Caithness, Sutherland and Easter Ross"
.. ..$ parliamentary_constituency_2024: chr "Caithness, Sutherland and Easter Ross"
.. ..$ admin_district : chr "Highland"
.. ..$ parish : NULL
.. ..$ admin_county : NULL
.. ..$ date_of_introduction : chr "198001"
.. ..$ admin_ward : chr "Tain and Easter Ross"
.. ..$ ced : NULL
.. ..$ ccg : chr "Highland Health and Social Care Partnership"
.. ..$ nuts : chr "Ross and Cromarty"
.. ..$ pfa : chr "Scotland"
.. ..$ codes :List of 14
.. .. ..$ admin_district : chr "S12000017"
.. .. ..$ admin_county : chr "S99999999"
.. .. ..$ admin_ward : chr "S13002996"
.. .. ..$ parish : chr "S99999999"
.. .. ..$ parliamentary_constituency : chr "S14000069"
.. .. ..$ parliamentary_constituency_2024: chr "S14000069"
.. .. ..$ ccg : chr "S03000044"
.. .. ..$ ccg_id : chr "044"
.. .. ..$ ced : chr "S99999999"
.. .. ..$ nuts : chr "TLM61"
.. .. ..$ lsoa : chr "S01010755"
.. .. ..$ msoa : chr "S02002023"
.. .. ..$ lau2 : chr "S30000028"
.. .. ..$ pfa : chr "S23000009"#postcode look up
bulk_list <- lapply(bulk_lookup_result, "[[", 2)
TT_foodbank_location_points4 <-
map_dfr(bulk_list,
`[`,
c("postcode", "longitude", "latitude"))
#as spatial points
TT_foodbank_location_points4 <-
st_as_sf(TT_foodbank_location_points4,
coords = c("longitude", "latitude"), crs = 4326)TT_foodbanks5 <- TT_foodbanks[401:500, ]
#make postcodes into a list
list <- as.list(unique(TT_foodbanks5$postcode))
#foodbank locations
#lat and long from postcodes
pc_list <- list(postcodes = list)
bulk_lookup_result <- bulk_postcode_lookup(pc_list)
str(bulk_lookup_result[1])List of 1
$ :List of 2
..$ query : chr "LD39EA"
..$ result:List of 27
.. ..$ postcode : chr "LD3 9EA"
.. ..$ quality : int 1
.. ..$ eastings : int 304317
.. ..$ northings : int 229234
.. ..$ country : chr "Wales"
.. ..$ nhs_ha : chr "Powys Teaching Health Board"
.. ..$ longitude : num -3.39
.. ..$ latitude : num 52
.. ..$ european_electoral_region : chr "Wales"
.. ..$ primary_care_trust : chr "Powys Teaching Health Board"
.. ..$ region : NULL
.. ..$ lsoa : chr "Powys 017F"
.. ..$ msoa : chr "Powys 017"
.. ..$ incode : chr "9EA"
.. ..$ outcode : chr "LD3"
.. ..$ parliamentary_constituency : chr "Brecon, Radnor and Cwm Tawe"
.. ..$ parliamentary_constituency_2024: chr "Brecon, Radnor and Cwm Tawe"
.. ..$ admin_district : chr "Powys"
.. ..$ parish : chr "Brecon"
.. ..$ admin_county : NULL
.. ..$ date_of_introduction : chr "198001"
.. ..$ admin_ward : chr "Brecon West"
.. ..$ ced : NULL
.. ..$ ccg : chr "Powys Teaching"
.. ..$ nuts : chr "Powys"
.. ..$ pfa : chr "Dyfed-Powys"
.. ..$ codes :List of 14
.. .. ..$ admin_district : chr "W06000023"
.. .. ..$ admin_county : chr "W99999999"
.. .. ..$ admin_ward : chr "W05001121"
.. .. ..$ parish : chr "W04000255"
.. .. ..$ parliamentary_constituency : chr "W07000085"
.. .. ..$ parliamentary_constituency_2024: chr "W07000085"
.. .. ..$ ccg : chr "W11000024"
.. .. ..$ ccg_id : chr "7A7"
.. .. ..$ ced : chr "W99999999"
.. .. ..$ nuts : chr "TLL24"
.. .. ..$ lsoa : chr "W01001901"
.. .. ..$ msoa : chr "W02000113"
.. .. ..$ lau2 : chr "W06000023"
.. .. ..$ pfa : chr "W15000004"#postcode look up
bulk_list <- lapply(bulk_lookup_result, "[[", 2)
TT_foodbank_location_points5 <-
map_dfr(bulk_list,
`[`,
c("postcode", "longitude", "latitude"))
#as spatial points
TT_foodbank_location_points5 <-
st_as_sf(TT_foodbank_location_points5,
coords = c("longitude", "latitude"), crs = 4326)TT_foodbanks6 <- TT_foodbanks[501:600, ]
#make postcodes into a list
list <- as.list(unique(TT_foodbanks1$postcode))
#foodbank locations
#lat and long from postcodes
pc_list <- list(postcodes = list)
bulk_lookup_result <- bulk_postcode_lookup(pc_list)
str(bulk_lookup_result[1])List of 1
$ :List of 2
..$ query : chr "KT190JG"
..$ result:List of 27
.. ..$ postcode : chr "KT19 0JG"
.. ..$ quality : int 1
.. ..$ eastings : int 520624
.. ..$ northings : int 164193
.. ..$ country : chr "England"
.. ..$ nhs_ha : chr "South East Coast"
.. ..$ longitude : num -0.269
.. ..$ latitude : num 51.4
.. ..$ european_electoral_region : chr "South East"
.. ..$ primary_care_trust : chr "Surrey"
.. ..$ region : chr "South East"
.. ..$ lsoa : chr "Epsom and Ewell 002A"
.. ..$ msoa : chr "Epsom and Ewell 002"
.. ..$ incode : chr "0JG"
.. ..$ outcode : chr "KT19"
.. ..$ parliamentary_constituency : chr "Epsom and Ewell"
.. ..$ parliamentary_constituency_2024: chr "Epsom and Ewell"
.. ..$ admin_district : chr "Epsom and Ewell"
.. ..$ parish : chr "Epsom and Ewell, unparished area"
.. ..$ admin_county : chr "Surrey"
.. ..$ date_of_introduction : chr "198001"
.. ..$ admin_ward : chr "Ewell Court"
.. ..$ ced : chr "Ewell Court, Auriol and Cuddington"
.. ..$ ccg : chr "NHS Surrey Heartlands"
.. ..$ nuts : chr "Epsom and Ewell"
.. ..$ pfa : chr "Surrey"
.. ..$ codes :List of 14
.. .. ..$ admin_district : chr "E07000208"
.. .. ..$ admin_county : chr "E10000030"
.. .. ..$ admin_ward : chr "E05015097"
.. .. ..$ parish : chr "E43000137"
.. .. ..$ parliamentary_constituency : chr "E14001227"
.. .. ..$ parliamentary_constituency_2024: chr "E14001227"
.. .. ..$ ccg : chr "E38000264"
.. .. ..$ ccg_id : chr "92A"
.. .. ..$ ced : chr "E58001483"
.. .. ..$ nuts : chr "TLJ26"
.. .. ..$ lsoa : chr "E01030394"
.. .. ..$ msoa : chr "E02006336"
.. .. ..$ lau2 : chr "E07000208"
.. .. ..$ pfa : chr "E23000031"#postcode look up
bulk_list <- lapply(bulk_lookup_result, "[[", 2)
TT_foodbank_location_points6 <-
map_dfr(bulk_list,
`[`,
c("postcode", "longitude", "latitude"))
#as spatial points
TT_foodbank_location_points6 <-
st_as_sf(TT_foodbank_location_points6,
coords = c("longitude", "latitude"), crs = 4326)TT_foodbanks7 <- TT_foodbanks[601:700, ]
#make postcodes into a list
list <- as.list(unique(TT_foodbanks7$postcode))
#foodbank locations
#lat and long from postcodes
pc_list <- list(postcodes = list)
bulk_lookup_result <- bulk_postcode_lookup(pc_list)
str(bulk_lookup_result[1])List of 1
$ :List of 2
..$ query : chr "CW109AR"
..$ result:List of 27
.. ..$ postcode : chr "CW10 9AR"
.. ..$ quality : int 1
.. ..$ eastings : int 370328
.. ..$ northings : int 366143
.. ..$ country : chr "England"
.. ..$ nhs_ha : chr "North West"
.. ..$ longitude : num -2.45
.. ..$ latitude : num 53.2
.. ..$ european_electoral_region : chr "North West"
.. ..$ primary_care_trust : chr "Central and Eastern Cheshire"
.. ..$ region : chr "North West"
.. ..$ lsoa : chr "Cheshire East 024C"
.. ..$ msoa : chr "Cheshire East 024"
.. ..$ incode : chr "9AR"
.. ..$ outcode : chr "CW10"
.. ..$ parliamentary_constituency : chr "Mid Cheshire"
.. ..$ parliamentary_constituency_2024: chr "Mid Cheshire"
.. ..$ admin_district : chr "Cheshire East"
.. ..$ parish : chr "Middlewich"
.. ..$ admin_county : NULL
.. ..$ date_of_introduction : chr "198001"
.. ..$ admin_ward : chr "Middlewich"
.. ..$ ced : NULL
.. ..$ ccg : chr "NHS Cheshire and Merseyside"
.. ..$ nuts : chr "Cheshire East"
.. ..$ pfa : chr "Cheshire"
.. ..$ codes :List of 14
.. .. ..$ admin_district : chr "E06000049"
.. .. ..$ admin_county : chr "E99999999"
.. .. ..$ admin_ward : chr "E05008640"
.. .. ..$ parish : chr "E04013194"
.. .. ..$ parliamentary_constituency : chr "E14001361"
.. .. ..$ parliamentary_constituency_2024: chr "E14001361"
.. .. ..$ ccg : chr "E38000233"
.. .. ..$ ccg_id : chr "27D"
.. .. ..$ ced : chr "E99999999"
.. .. ..$ nuts : chr "TLD62"
.. .. ..$ lsoa : chr "E01018426"
.. .. ..$ msoa : chr "E02003813"
.. .. ..$ lau2 : chr "E06000049"
.. .. ..$ pfa : chr "E23000006"#postcode look up
bulk_list <- lapply(bulk_lookup_result, "[[", 2)
TT_foodbank_location_points7 <-
map_dfr(bulk_list,
`[`,
c("postcode", "longitude", "latitude"))
#as spatial points
TT_foodbank_location_points7 <-
st_as_sf(TT_foodbank_location_points7,
coords = c("longitude", "latitude"), crs = 4326)TT_foodbanks8 <- TT_foodbanks[701:800, ]
#make postcodes into a list
list <- as.list(unique(TT_foodbanks8$postcode))
#foodbank locations
#lat and long from postcodes
pc_list <- list(postcodes = list)
bulk_lookup_result <- bulk_postcode_lookup(pc_list)
str(bulk_lookup_result[1])List of 1
$ :List of 2
..$ query : chr "WR101DT"
..$ result:List of 27
.. ..$ postcode : chr "WR10 1DT"
.. ..$ quality : int 1
.. ..$ eastings : int 394862
.. ..$ northings : int 245902
.. ..$ country : chr "England"
.. ..$ nhs_ha : chr "West Midlands"
.. ..$ longitude : num -2.08
.. ..$ latitude : num 52.1
.. ..$ european_electoral_region : chr "West Midlands"
.. ..$ primary_care_trust : chr "Worcestershire"
.. ..$ region : chr "West Midlands"
.. ..$ lsoa : chr "Wychavon 012B"
.. ..$ msoa : chr "Wychavon 012"
.. ..$ incode : chr "1DT"
.. ..$ outcode : chr "WR10"
.. ..$ parliamentary_constituency : chr "West Worcestershire"
.. ..$ parliamentary_constituency_2024: chr "West Worcestershire"
.. ..$ admin_district : chr "Wychavon"
.. ..$ parish : chr "Pershore"
.. ..$ admin_county : chr "Worcestershire"
.. ..$ date_of_introduction : chr "198001"
.. ..$ admin_ward : chr "Pershore"
.. ..$ ced : chr "Pershore"
.. ..$ ccg : chr "NHS Herefordshire and Worcestershire"
.. ..$ nuts : chr "Wychavon"
.. ..$ pfa : chr "West Mercia"
.. ..$ codes :List of 14
.. .. ..$ admin_district : chr "E07000238"
.. .. ..$ admin_county : chr "E10000034"
.. .. ..$ admin_ward : chr "E05015463"
.. .. ..$ parish : chr "E04010425"
.. .. ..$ parliamentary_constituency : chr "E14001579"
.. .. ..$ parliamentary_constituency_2024: chr "E14001579"
.. .. ..$ ccg : chr "E38000236"
.. .. ..$ ccg_id : chr "18C"
.. .. ..$ ced : chr "E58001701"
.. .. ..$ nuts : chr "TLG12"
.. .. ..$ lsoa : chr "E01032406"
.. .. ..$ msoa : chr "E02006759"
.. .. ..$ lau2 : chr "E07000238"
.. .. ..$ pfa : chr "E23000016"#postcode look up
bulk_list <- lapply(bulk_lookup_result, "[[", 2)
TT_foodbank_location_points8 <-
map_dfr(bulk_list,
`[`,
c("postcode", "longitude", "latitude"))
#as spatial points
TT_foodbank_location_points8 <-
st_as_sf(TT_foodbank_location_points8,
coords = c("longitude", "latitude"), crs = 4326)TT_foodbanks9 <- TT_foodbanks[801:900, ]
#make postcodes into a list
list <- as.list(unique(TT_foodbanks9$postcode))
#foodbank locations
#lat and long from postcodes
pc_list <- list(postcodes = list)
bulk_lookup_result <- bulk_postcode_lookup(pc_list)
str(bulk_lookup_result[1])List of 1
$ :List of 2
..$ query : chr "G211UX"
..$ result:List of 27
.. ..$ postcode : chr "G21 1UX"
.. ..$ quality : int 1
.. ..$ eastings : int 260572
.. ..$ northings : int 669090
.. ..$ country : chr "Scotland"
.. ..$ nhs_ha : chr "Greater Glasgow and Clyde"
.. ..$ longitude : num -4.23
.. ..$ latitude : num 55.9
.. ..$ european_electoral_region : chr "Scotland"
.. ..$ primary_care_trust : chr "Glasgow City Community Health Partnership"
.. ..$ region : NULL
.. ..$ lsoa : chr "Springburn East and Cowlairs - 02"
.. ..$ msoa : chr "Springburn East and Cowlairs"
.. ..$ incode : chr "1UX"
.. ..$ outcode : chr "G21"
.. ..$ parliamentary_constituency : chr "Glasgow North East"
.. ..$ parliamentary_constituency_2024: chr "Glasgow North East"
.. ..$ admin_district : chr "Glasgow City"
.. ..$ parish : NULL
.. ..$ admin_county : NULL
.. ..$ date_of_introduction : chr "198001"
.. ..$ admin_ward : chr "Springburn/Robroyston"
.. ..$ ced : NULL
.. ..$ ccg : chr "Glasgow City Community Health & Care Partnership"
.. ..$ nuts : chr "Glasgow City"
.. ..$ pfa : chr "Scotland"
.. ..$ codes :List of 14
.. .. ..$ admin_district : chr "S12000049"
.. .. ..$ admin_county : chr "S99999999"
.. .. ..$ admin_ward : chr "S13002983"
.. .. ..$ parish : chr "S99999999"
.. .. ..$ parliamentary_constituency : chr "S14000086"
.. .. ..$ parliamentary_constituency_2024: chr "S14000086"
.. .. ..$ ccg : chr "S03000043"
.. .. ..$ ccg_id : chr "043"
.. .. ..$ ced : chr "S99999999"
.. .. ..$ nuts : chr "TLM82"
.. .. ..$ lsoa : chr "S01010215"
.. .. ..$ msoa : chr "S02001923"
.. .. ..$ lau2 : chr "S30000052"
.. .. ..$ pfa : chr "S23000009"#postcode look up
bulk_list <- lapply(bulk_lookup_result, "[[", 2)
TT_foodbank_location_points9 <-
map_dfr(bulk_list,
`[`,
c("postcode", "longitude", "latitude"))
#as spatial points
TT_foodbank_location_points9 <-
st_as_sf(TT_foodbank_location_points9,
coords = c("longitude", "latitude"), crs = 4326)TT_foodbanks10 <- TT_foodbanks[901:1000, ]
#make postcodes into a list
list <- as.list(unique(TT_foodbanks10$postcode))
#foodbank locations
#lat and long from postcodes
pc_list <- list(postcodes = list)
bulk_lookup_result <- bulk_postcode_lookup(pc_list)
str(bulk_lookup_result[1])List of 1
$ :List of 2
..$ query : chr "BN38EQ"
..$ result:List of 27
.. ..$ postcode : chr "BN3 8EQ"
.. ..$ quality : int 1
.. ..$ eastings : int 526765
.. ..$ northings : int 107097
.. ..$ country : chr "England"
.. ..$ nhs_ha : chr "South East Coast"
.. ..$ longitude : num -0.201
.. ..$ latitude : num 50.8
.. ..$ european_electoral_region : chr "South East"
.. ..$ primary_care_trust : chr "Brighton and Hove City"
.. ..$ region : chr "South East"
.. ..$ lsoa : chr "Brighton and Hove 006B"
.. ..$ msoa : chr "Brighton and Hove 006"
.. ..$ incode : chr "8EQ"
.. ..$ outcode : chr "BN3"
.. ..$ parliamentary_constituency : chr "Hove and Portslade"
.. ..$ parliamentary_constituency_2024: chr "Hove and Portslade"
.. ..$ admin_district : chr "Brighton and Hove"
.. ..$ parish : chr "Brighton and Hove, unparished area"
.. ..$ admin_county : NULL
.. ..$ date_of_introduction : chr "198001"
.. ..$ admin_ward : chr "Hangleton & Knoll"
.. ..$ ced : NULL
.. ..$ ccg : chr "NHS Sussex"
.. ..$ nuts : chr "Brighton and Hove"
.. ..$ pfa : chr "Sussex"
.. ..$ codes :List of 14
.. .. ..$ admin_district : chr "E06000043"
.. .. ..$ admin_county : chr "E99999999"
.. .. ..$ admin_ward : chr "E05015402"
.. .. ..$ parish : chr "E43000034"
.. .. ..$ parliamentary_constituency : chr "E14001296"
.. .. ..$ parliamentary_constituency_2024: chr "E14001296"
.. .. ..$ ccg : chr "E38000021"
.. .. ..$ ccg_id : chr "09D"
.. .. ..$ ced : chr "E99999999"
.. .. ..$ nuts : chr "TLJ21"
.. .. ..$ lsoa : chr "E01016883"
.. .. ..$ msoa : chr "E02003496"
.. .. ..$ lau2 : chr "E06000043"
.. .. ..$ pfa : chr "E23000033"#postcode look up
bulk_list <- lapply(bulk_lookup_result, "[[", 2)
TT_foodbank_location_points10 <-
map_dfr(bulk_list,
`[`,
c("postcode", "longitude", "latitude"))
#as spatial points
TT_foodbank_location_points10 <-
st_as_sf(TT_foodbank_location_points10,
coords = c("longitude", "latitude"), crs = 4326)TT_foodbanks11 <- TT_foodbanks[1001:1100, ]
#make postcodes into a list
list <- as.list(unique(TT_foodbanks11$postcode))
#foodbank locations
#lat and long from postcodes
pc_list <- list(postcodes = list)
bulk_lookup_result <- bulk_postcode_lookup(pc_list)
str(bulk_lookup_result[1])List of 1
$ :List of 2
..$ query : chr "NG94HU"
..$ result:List of 27
.. ..$ postcode : chr "NG9 4HU"
.. ..$ quality : int 1
.. ..$ eastings : int 450673
.. ..$ northings : int 336540
.. ..$ country : chr "England"
.. ..$ nhs_ha : chr "East Midlands"
.. ..$ longitude : num -1.25
.. ..$ latitude : num 52.9
.. ..$ european_electoral_region : chr "East Midlands"
.. ..$ primary_care_trust : chr "Nottinghamshire County Teaching"
.. ..$ region : chr "East Midlands"
.. ..$ lsoa : chr "Broxtowe 013E"
.. ..$ msoa : chr "Broxtowe 013"
.. ..$ incode : chr "4HU"
.. ..$ outcode : chr "NG9"
.. ..$ parliamentary_constituency : chr "Broxtowe"
.. ..$ parliamentary_constituency_2024: chr "Broxtowe"
.. ..$ admin_district : chr "Broxtowe"
.. ..$ parish : chr "Broxtowe, unparished area"
.. ..$ admin_county : chr "Nottinghamshire"
.. ..$ date_of_introduction : chr "198001"
.. ..$ admin_ward : chr "Chilwell West"
.. ..$ ced : chr "Toton, Chilwell & Attenborough"
.. ..$ ccg : chr "NHS Nottingham and Nottinghamshire"
.. ..$ nuts : chr "Broxtowe"
.. ..$ pfa : chr "Nottinghamshire"
.. ..$ codes :List of 14
.. .. ..$ admin_district : chr "E07000172"
.. .. ..$ admin_county : chr "E10000024"
.. .. ..$ admin_ward : chr "E05010522"
.. .. ..$ parish : chr "E43000289"
.. .. ..$ parliamentary_constituency : chr "E14001140"
.. .. ..$ parliamentary_constituency_2024: chr "E14001140"
.. .. ..$ ccg : chr "E38000243"
.. .. ..$ ccg_id : chr "52R"
.. .. ..$ ced : chr "E58001212"
.. .. ..$ nuts : chr "TLF16"
.. .. ..$ lsoa : chr "E01028101"
.. .. ..$ msoa : chr "E02005862"
.. .. ..$ lau2 : chr "E07000172"
.. .. ..$ pfa : chr "E23000019"#postcode look up
bulk_list <- lapply(bulk_lookup_result, "[[", 2)
TT_foodbank_location_points11 <-
map_dfr(bulk_list,
`[`,
c("postcode", "longitude", "latitude"))
#as spatial points
TT_foodbank_location_points11 <-
st_as_sf(TT_foodbank_location_points11,
coords = c("longitude", "latitude"), crs = 4326)TT_foodbanks12 <- TT_foodbanks[1101:1200, ]
#make postcodes into a list
list <- as.list(unique(TT_foodbanks12$postcode))
#foodbank locations
#lat and long from postcodes
pc_list <- list(postcodes = list)
bulk_lookup_result <- bulk_postcode_lookup(pc_list)
str(bulk_lookup_result[1])List of 1
$ :List of 2
..$ query : chr "SY217LN"
..$ result:List of 27
.. ..$ postcode : chr "SY21 7LN"
.. ..$ quality : int 1
.. ..$ eastings : int 322135
.. ..$ northings : int 307533
.. ..$ country : chr "Wales"
.. ..$ nhs_ha : chr "Powys Teaching Health Board"
.. ..$ longitude : num -3.15
.. ..$ latitude : num 52.7
.. ..$ european_electoral_region : chr "Wales"
.. ..$ primary_care_trust : chr "Powys Teaching Health Board"
.. ..$ region : NULL
.. ..$ lsoa : chr "Powys 003A"
.. ..$ msoa : chr "Powys 003"
.. ..$ incode : chr "7LN"
.. ..$ outcode : chr "SY21"
.. ..$ parliamentary_constituency : chr "Montgomeryshire and Glyndwr"
.. ..$ parliamentary_constituency_2024: chr "Montgomeryshire and Glyndwr"
.. ..$ admin_district : chr "Powys"
.. ..$ parish : chr "Welshpool"
.. ..$ admin_county : NULL
.. ..$ date_of_introduction : chr "198001"
.. ..$ admin_ward : chr "Welshpool Castle"
.. ..$ ced : NULL
.. ..$ ccg : chr "Powys Teaching"
.. ..$ nuts : chr "Powys"
.. ..$ pfa : chr "Dyfed-Powys"
.. ..$ codes :List of 14
.. .. ..$ admin_district : chr "W06000023"
.. .. ..$ admin_county : chr "W99999999"
.. .. ..$ admin_ward : chr "W05001172"
.. .. ..$ parish : chr "W04000352"
.. .. ..$ parliamentary_constituency : chr "W07000102"
.. .. ..$ parliamentary_constituency_2024: chr "W07000102"
.. .. ..$ ccg : chr "W11000024"
.. .. ..$ ccg_id : chr "7A7"
.. .. ..$ ced : chr "W99999999"
.. .. ..$ nuts : chr "TLL24"
.. .. ..$ lsoa : chr "W01000498"
.. .. ..$ msoa : chr "W02000099"
.. .. ..$ lau2 : chr "W06000023"
.. .. ..$ pfa : chr "W15000004"#postcode look up
bulk_list <- lapply(bulk_lookup_result, "[[", 2)
TT_foodbank_location_points12 <-
map_dfr(bulk_list,
`[`,
c("postcode", "longitude", "latitude"))
#as spatial points
TT_foodbank_location_points12 <-
st_as_sf(TT_foodbank_location_points12,
coords = c("longitude", "latitude"), crs = 4326)TT_foodbanks13 <- TT_foodbanks[1201:1300, ]
#make postcodes into a list
list <- as.list(unique(TT_foodbanks13$postcode))
#foodbank locations
#lat and long from postcodes
pc_list <- list(postcodes = list)
bulk_lookup_result <- bulk_postcode_lookup(pc_list)
str(bulk_lookup_result[1])List of 1
$ :List of 2
..$ query : chr "SN95ES"
..$ result:List of 27
.. ..$ postcode : chr "SN9 5ES"
.. ..$ quality : int 1
.. ..$ eastings : int 416336
.. ..$ northings : int 160154
.. ..$ country : chr "England"
.. ..$ nhs_ha : chr "South West"
.. ..$ longitude : num -1.77
.. ..$ latitude : num 51.3
.. ..$ european_electoral_region : chr "South West"
.. ..$ primary_care_trust : chr "Wiltshire"
.. ..$ region : chr "South West"
.. ..$ lsoa : chr "Wiltshire 024C"
.. ..$ msoa : chr "Wiltshire 024"
.. ..$ incode : chr "5ES"
.. ..$ outcode : chr "SN9"
.. ..$ parliamentary_constituency : chr "East Wiltshire"
.. ..$ parliamentary_constituency_2024: chr "East Wiltshire"
.. ..$ admin_district : chr "Wiltshire"
.. ..$ parish : chr "Pewsey"
.. ..$ admin_county : NULL
.. ..$ date_of_introduction : chr "198001"
.. ..$ admin_ward : chr "Pewsey"
.. ..$ ced : NULL
.. ..$ ccg : chr "NHS Bath and North East Somerset, Swindon and Wiltshire"
.. ..$ nuts : chr "Wiltshire"
.. ..$ pfa : chr "Wiltshire"
.. ..$ codes :List of 14
.. .. ..$ admin_district : chr "E06000054"
.. .. ..$ admin_county : chr "E99999999"
.. .. ..$ admin_ward : chr "E05013834"
.. .. ..$ parish : chr "E04013045"
.. .. ..$ parliamentary_constituency : chr "E14001217"
.. .. ..$ parliamentary_constituency_2024: chr "E14001217"
.. .. ..$ ccg : chr "E38000231"
.. .. ..$ ccg_id : chr "92G"
.. .. ..$ ced : chr "E99999999"
.. .. ..$ nuts : chr "TLK15"
.. .. ..$ lsoa : chr "E01031870"
.. .. ..$ msoa : chr "E02006636"
.. .. ..$ lau2 : chr "E06000054"
.. .. ..$ pfa : chr "E23000038"#postcode look up
bulk_list <- lapply(bulk_lookup_result, "[[", 2)
TT_foodbank_location_points13 <-
map_dfr(bulk_list,
`[`,
c("postcode", "longitude", "latitude"))
#as spatial points
TT_foodbank_location_points13 <-
st_as_sf(TT_foodbank_location_points13,
coords = c("longitude", "latitude"), crs = 4326)TT_foodbanks14 <- TT_foodbanks[1301:1400, ]
#make postcodes into a list
list <- as.list(unique(TT_foodbanks14$postcode))
#foodbank locations
#lat and long from postcodes
pc_list <- list(postcodes = list)
bulk_lookup_result <- bulk_postcode_lookup(pc_list)
str(bulk_lookup_result[1])List of 1
$ :List of 2
..$ query : chr "EX48LZ"
..$ result:List of 27
.. ..$ postcode : chr "EX4 8LZ"
.. ..$ quality : int 1
.. ..$ eastings : int 294494
.. ..$ northings : int 94335
.. ..$ country : chr "England"
.. ..$ nhs_ha : chr "South West"
.. ..$ longitude : num -3.5
.. ..$ latitude : num 50.7
.. ..$ european_electoral_region : chr "South West"
.. ..$ primary_care_trust : chr "Devon"
.. ..$ region : chr "South West"
.. ..$ lsoa : chr "Exeter 002B"
.. ..$ msoa : chr "Exeter 002"
.. ..$ incode : chr "8LZ"
.. ..$ outcode : chr "EX4"
.. ..$ parliamentary_constituency : chr "Exeter"
.. ..$ parliamentary_constituency_2024: chr "Exeter"
.. ..$ admin_district : chr "Exeter"
.. ..$ parish : chr "Exeter, unparished area"
.. ..$ admin_county : chr "Devon"
.. ..$ date_of_introduction : chr "198001"
.. ..$ admin_ward : chr "Mincinglake and Whipton"
.. ..$ ced : chr "Pinhoe & Mincinglake"
.. ..$ ccg : chr "NHS Devon"
.. ..$ nuts : chr "Exeter"
.. ..$ pfa : chr "Devon & Cornwall"
.. ..$ codes :List of 14
.. .. ..$ admin_district : chr "E07000041"
.. .. ..$ admin_county : chr "E10000008"
.. .. ..$ admin_ward : chr "E05011015"
.. .. ..$ parish : chr "E43000052"
.. .. ..$ parliamentary_constituency : chr "E14001231"
.. .. ..$ parliamentary_constituency_2024: chr "E14001231"
.. .. ..$ ccg : chr "E38000230"
.. .. ..$ ccg_id : chr "15N"
.. .. ..$ ced : chr "E58000293"
.. .. ..$ nuts : chr "TLK43"
.. .. ..$ lsoa : chr "E01019991"
.. .. ..$ msoa : chr "E02004150"
.. .. ..$ lau2 : chr "E07000041"
.. .. ..$ pfa : chr "E23000035"#postcode look up
bulk_list <- lapply(bulk_lookup_result, "[[", 2)
TT_foodbank_location_points14 <-
map_dfr(bulk_list,
`[`,
c("postcode", "longitude", "latitude"))
#as spatial points
TT_foodbank_location_points14 <-
st_as_sf(TT_foodbank_location_points14,
coords = c("longitude", "latitude"), crs = 4326)TT_foodbanks15 <- TT_foodbanks[1401:1425, ]
#make postcodes into a list
list <- as.list(unique(TT_foodbanks15$postcode))
#foodbank locations
#lat and long from postcodes
pc_list <- list(postcodes = list)
bulk_lookup_result <- bulk_postcode_lookup(pc_list)
str(bulk_lookup_result[1])List of 1
$ :List of 2
..$ query : chr "L269UH"
..$ result:List of 27
.. ..$ postcode : chr "L26 9UH"
.. ..$ quality : int 1
.. ..$ eastings : int 345152
.. ..$ northings : int 384999
.. ..$ country : chr "England"
.. ..$ nhs_ha : chr "North West"
.. ..$ longitude : num -2.83
.. ..$ latitude : num 53.4
.. ..$ european_electoral_region : chr "North West"
.. ..$ primary_care_trust : chr "Knowsley"
.. ..$ region : chr "North West"
.. ..$ lsoa : chr "Knowsley 020B"
.. ..$ msoa : chr "Knowsley 020"
.. ..$ incode : chr "9UH"
.. ..$ outcode : chr "L26"
.. ..$ parliamentary_constituency : chr "Widnes and Halewood"
.. ..$ parliamentary_constituency_2024: chr "Widnes and Halewood"
.. ..$ admin_district : chr "Knowsley"
.. ..$ parish : chr "Halewood"
.. ..$ admin_county : NULL
.. ..$ date_of_introduction : chr "198001"
.. ..$ admin_ward : chr "Halewood South"
.. ..$ ced : NULL
.. ..$ ccg : chr "NHS Cheshire and Merseyside"
.. ..$ nuts : chr "Knowsley"
.. ..$ pfa : chr "Merseyside"
.. ..$ codes :List of 14
.. .. ..$ admin_district : chr "E08000011"
.. .. ..$ admin_county : chr "E99999999"
.. .. ..$ admin_ward : chr "E05010937"
.. .. ..$ parish : chr "E04000017"
.. .. ..$ parliamentary_constituency : chr "E14001584"
.. .. ..$ parliamentary_constituency_2024: chr "E14001584"
.. .. ..$ ccg : chr "E38000091"
.. .. ..$ ccg_id : chr "01J"
.. .. ..$ ced : chr "E99999999"
.. .. ..$ nuts : chr "TLD71"
.. .. ..$ lsoa : chr "E01006428"
.. .. ..$ msoa : chr "E02001346"
.. .. ..$ lau2 : chr "E08000011"
.. .. ..$ pfa : chr "E23000004"#postcode look up
bulk_list <- lapply(bulk_lookup_result, "[[", 2)
TT_foodbank_location_points15 <-
map_dfr(bulk_list,
`[`,
c("postcode", "longitude", "latitude"))
#as spatial points
TT_foodbank_location_points15 <-
st_as_sf(TT_foodbank_location_points15,
coords = c("longitude", "latitude"), crs = 4326)After all the Trussell centres have had their point location derived, we bind them together in one data frame.
TT_foodbank_location_points <- rbind(TT_foodbank_location_points1, TT_foodbank_location_points2,
                                     TT_foodbank_location_points3, TT_foodbank_location_points4,
                                     TT_foodbank_location_points5, TT_foodbank_location_points6,
                                     TT_foodbank_location_points7, TT_foodbank_location_points8,
                                     TT_foodbank_location_points9, TT_foodbank_location_points10,
                                     TT_foodbank_location_points11, TT_foodbank_location_points12,
                                     TT_foodbank_location_points13, TT_foodbank_location_points14,
TT_foodbank_location_points15)nrow(TT_foodbanks) - nrow(TT_foodbank_location_points)[1] 42This process has lost 42 food bank centres as postcode could not be recognised/matched with a longitude and latitude.
We need to join the point location to the other information on the food bank centres like the centre’s name and the operating model etc.
#removing white space from postcodes in order to merge with more information
TT_foodbank_location_points$postcode <- gsub("[[:space:]]", "", TT_foodbank_location_points$postcode)

#joining point data with other information on food bank centres e.g. name and operating model
TT_foodbank_location_points <- TT_foodbank_location_points %>%
  merge(.,
        TT_foodbanks,
        by.x = "postcode",
        by.y = "postcode",
        all.x = TRUE)

#select specific columns
TT_foodbank_location_points <- TT_foodbank_location_points %>%
  distinct(foodbank_centre_number, postcode, .keep_all = TRUE) %>%
  dplyr::select(food_bank_name, distribution_centre_name, foodbank_centre_number, postcode, operating_model, number_of_distribution_centres_final)
5.1.3 Create a map of Trussell food bank locations in the UK
Now we have the point location of Trussell centres, we can use the tmap package to visualise where the Trussell food bank centres are across the UK by making a simple map.
TT_foodbank_location_points <- TT_foodbank_location_points %>%
  st_transform(., 27700)

#clips the point locations to be only within the shape file area - excludes food banks outside the boundary
TT_foodbank_location_points <- TT_foodbank_location_points[UK_border,]

#plot map
Plain_map <-
  tm_shape(UK_border) +
  tm_fill(col = "antiquewhite", alpha = 0.5) +
  tm_borders(col = "black", lwd = 0.1) +
  tm_shape(TT_foodbank_location_points) +
  tm_symbols(col = "forestgreen", size = 0.03) +
  tm_scale_bar(position = c("left", "top")) +
  tm_compass(position = c("right", "top")) +
  tm_layout(main.title = "Trussell food bank centres",
            main.title.position = "centre",
            main.title.size = 0.7,
            legend.outside = TRUE, frame = FALSE)

Plain_map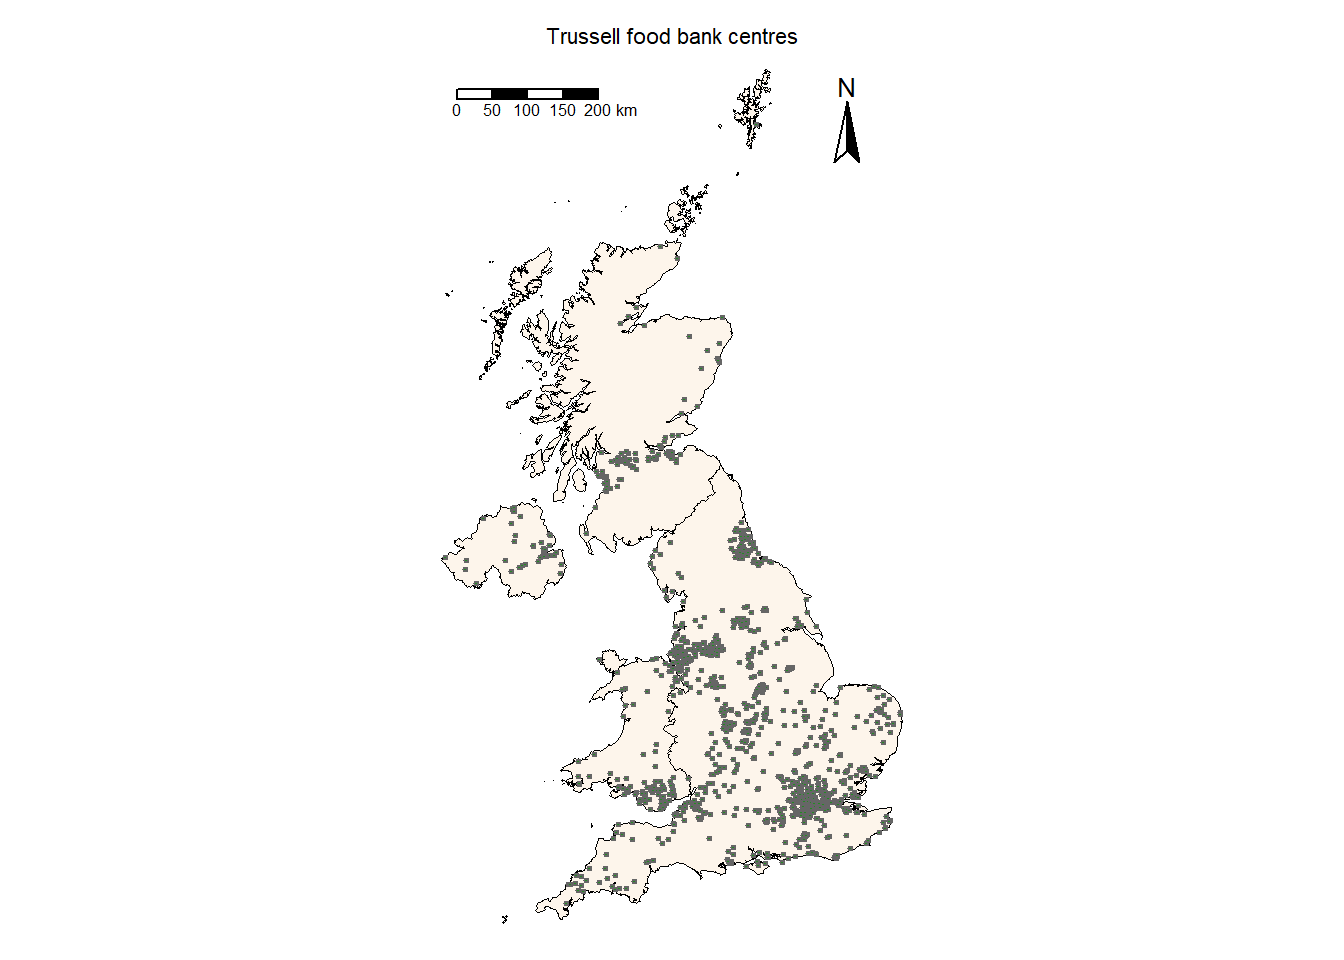
Note
Questions
- What does this tell up about the spatial distribution of food banks?
- What could be added to this map to enhance the visualisation?
5.2 Create a map of Trussell food bank locations in Oxford and Oxfordshire
Let’s zoom in on Oxford and the surrounding area.
#use string detect function to find local authorities with these words in their names
Oxford_LAs <- LA_2022 %>%
  filter(str_detect(lad22nm, "Oxford") |
           str_detect(lad22nm, "White Horse") |
           str_detect(lad22nm, "Cherwell"))
#use string detect function to isolate the border of the city of Oxford
Oxford_City_LAs <- LA_2022 %>%
filter(str_detect(lad22cd, "E07000178")) #find food bank centres from within the border we have created
Oxford_TT_foodbanks <- TT_foodbank_location_points[Oxford_LAs,]
Oxford_map <-
tm_shape(Oxford_LAs) +
tm_fill(col = "antiquewhite", alpha = 0.5) +
tm_borders(col = "black", lwd = 0.1) +
tm_shape(Oxford_City_LAs) +
tm_borders(col = "black", lwd = 1) + #bolder border around the City of Oxford
tm_shape(Oxford_TT_foodbanks) +
tm_symbols(col = "deepskyblue", size = 0.1) +
tm_scale_bar(position = c("right", "top")) +
tm_compass(position = c("right", "top")) +
tm_layout(main.title = "Trussell centres in & around Oxford",
main.title.position = "centre",
main.title.size = 0.9,
legend.outside = TRUE, frame = FALSE)
Oxford_map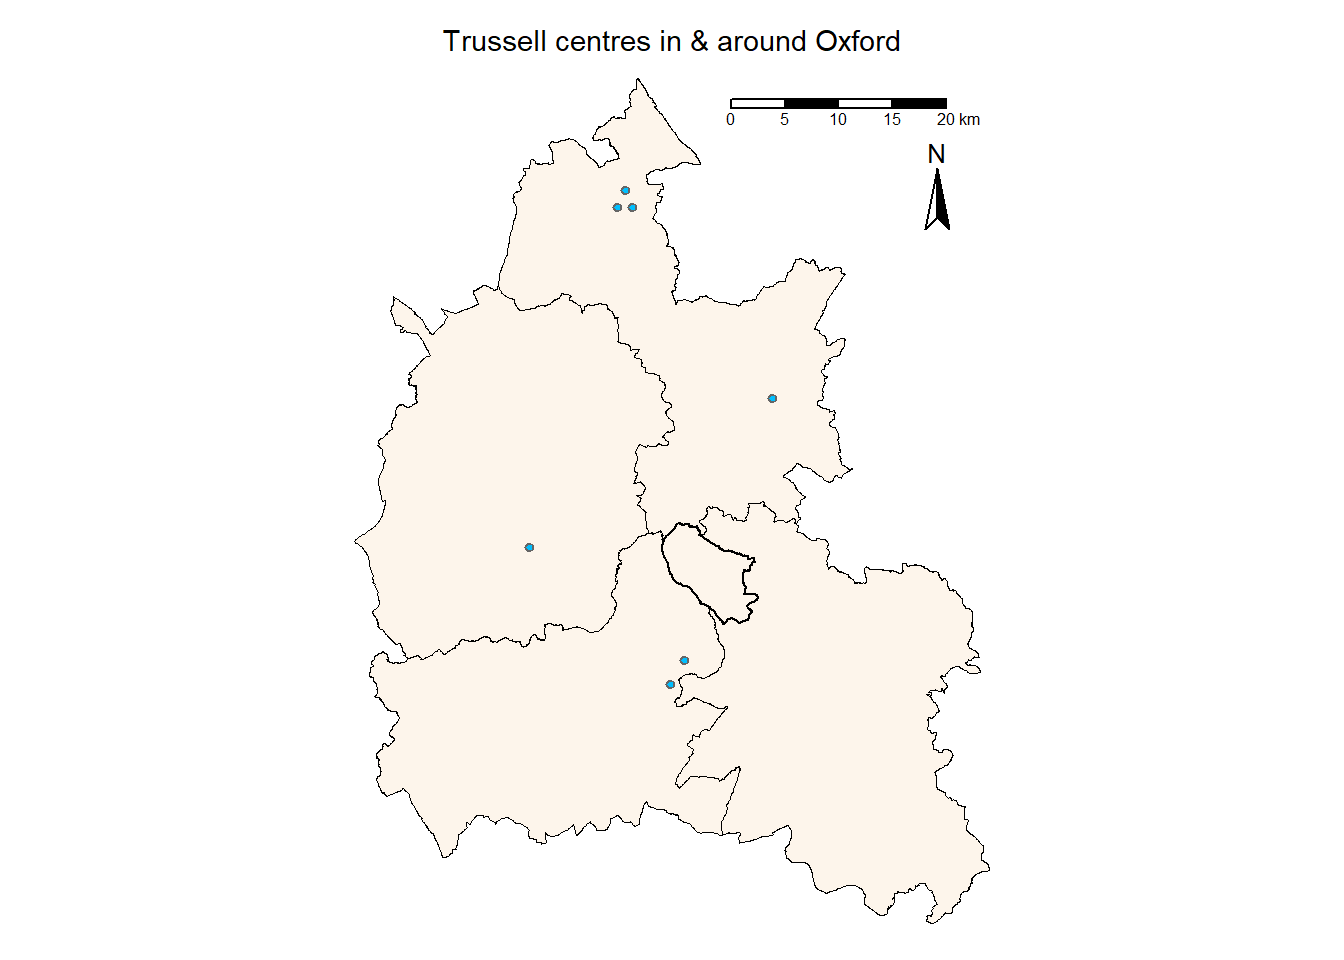
tmap_mode("view")

#plot map
Oxford_map <-
  tm_shape(Oxford_LAs) +
  tm_fill(col = "antiquewhite", alpha = 0.5) +
  tm_borders(col = "black", lwd = 0.1) +
  tm_shape(Oxford_City_LAs) +
  tm_borders(col = "black", lwd = 1) + #bolder border around the City of Oxford
  tm_shape(Oxford_TT_foodbanks) +
  tm_symbols(col = "deepskyblue", size = 0.1) +
  tm_scale_bar(position = c("right", "top")) +
  tm_compass(position = c("right", "top")) +
    tm_layout(main.title = "Trussell centres in/around Oxford",
            main.title.position = "centre",
            main.title.size = 0.9,
            legend.outside = TRUE, frame = FALSE)

Oxford_map
We see only seven food bank centres across the region, and no food bank centres in the City of Oxford itself, so we look at other sources of data to see if this is true.
5.2.1 Give Food food bank data
Give Food is an open access database with information on food banks in the UK. Next, load the food bank data with addresses (from Give Food). However, these are food banks and not distribution centres.
#data from give food
give_food_foodbanks <- read_csv("prac5_data/foodbanks.csv") %>%
  clean_names()
#removing white space from postcodes
give_food_foodbanks$postcode <- gsub("[[:space:]]", "", give_food_foodbanks$postcode)
#filter out only distribution centres
give_food_foodbanks <- give_food_foodbanks %>%
filter(closed != "TRUE") #remove centres that are currently closed#create 2 versions
Oxford_give_food_foodbanks <- give_food_foodbanks %>%
filter(str_detect(postcode, "OX"))
Oxford_give_food_foodbanks2 <- give_food_foodbanks %>%
filter(str_detect(postcode, "OX")) Oxford_give_food_foodbanks2$postcode <- gsub("[[:space:]]", "", Oxford_give_food_foodbanks2$postcode)
#create spatial object
Oxford_give_food_foodbanks2 <- Oxford_give_food_foodbanks2 %>%
st_transform(., 27700)
#select only specific variables needed
Oxford_give_food_foodbanks <- Oxford_give_food_foodbanks %>%
select(name, postcode, district, network)
Oxford_give_food_foodbanks <- Oxford_give_food_foodbanks2 %>%
merge(.,
Oxford_give_food_foodbanks,
by.x = "postcode",
by.y = "postcode",
all.x = TRUE)#create spatial object
Oxford_give_food_foodbanks <- Oxford_give_food_foodbanks %>%
st_transform(., 27700)
tmap_mode("plot")
#plot map
Oxford_map <-
tm_shape(Oxford_LAs) +
tm_fill(col = "antiquewhite", alpha = 0.5) +
tm_borders(col = "black", lwd = 0.1) +
tm_shape(Oxford_City_LAs) +
tm_borders(col = "black", lwd = 1) + #bolder border around the City of Oxford
tm_shape(Oxford_give_food_foodbanks) +
tm_symbols(col = "red", size = 0.1) +
tm_scale_bar(position = c("right", "top")) +
tm_compass(position = c("right", "top")) +
tm_layout(main.title = "Other food banks in & around Oxford",
main.title.position = "centre",
main.title.size = 0.9,
legend.outside = TRUE, frame = FALSE)
Oxford_map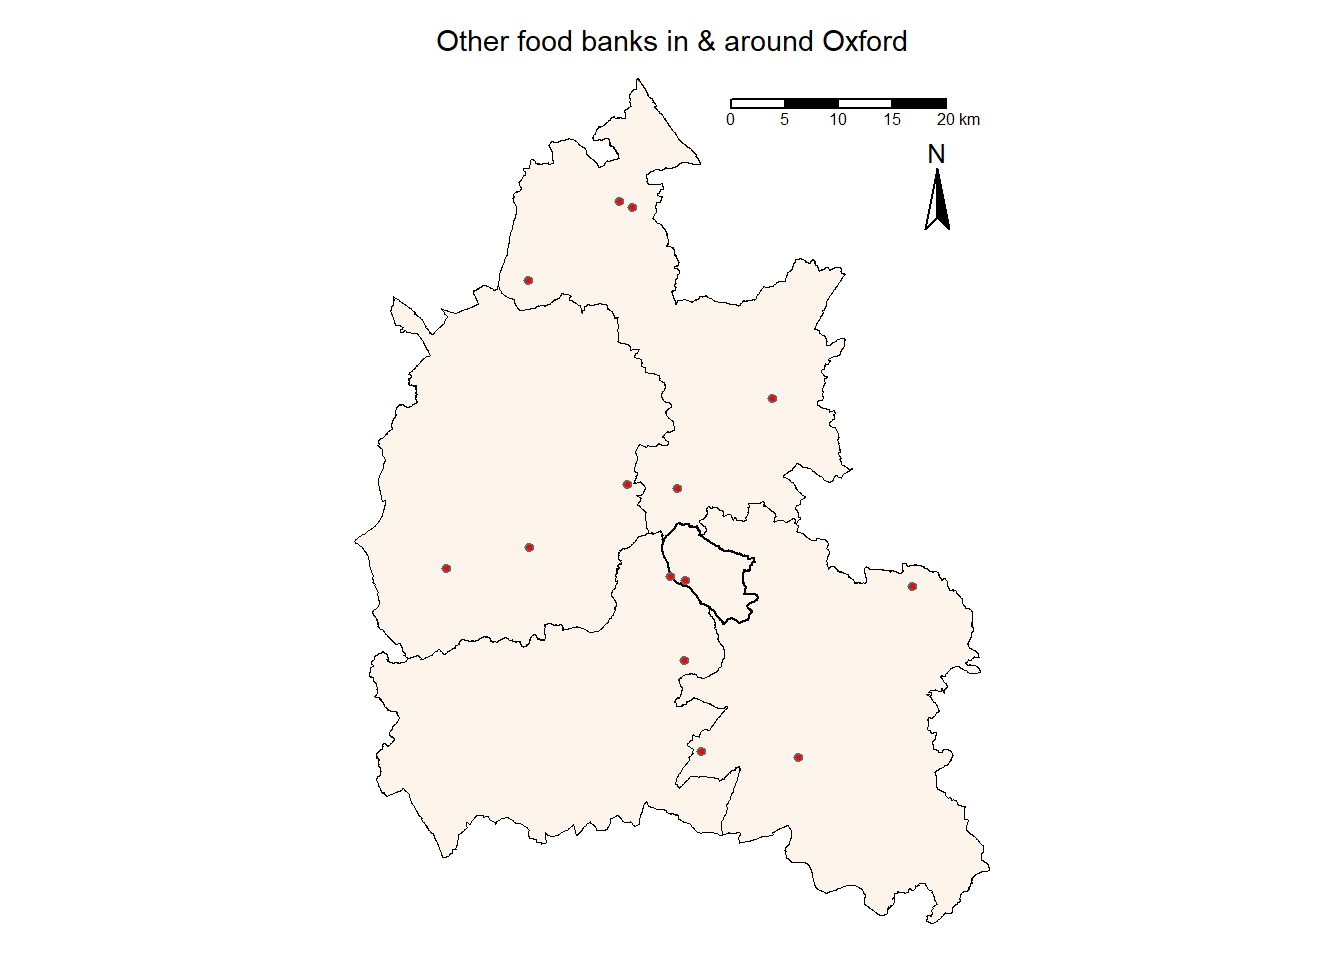
tmap_mode("view")

#plot map
Oxford_map <-
  tm_shape(Oxford_LAs) +
  tm_fill(col = "antiquewhite", alpha = 0.5) +
  tm_borders(col = "black", lwd = 0.1) +
  tm_shape(Oxford_City_LAs) +
  tm_borders(col = "black", lwd = 1) + #bolder border around the City of Oxford
  tm_shape(Oxford_give_food_foodbanks) +
  tm_symbols(col = "red", size = 0.1) +
  tm_scale_bar(position = c("right", "top")) +
  tm_compass(position = c("right", "top")) +
    tm_layout(main.title = "Other food banks in & around Oxford",
            main.title.position = "centre",
            main.title.size = 0.9,
            legend.outside = TRUE, frame = FALSE)

Oxford_map
If you hover over the food bank centres on the interactive map, information on the centre that is contained in the data frame will pop up in a box.
Next we map the same data, but spilt the centres by network type.
trussell_Oxford <- Oxford_give_food_foodbanks %>%
  filter(network == "Trussell")

IFAN_Oxford <- Oxford_give_food_foodbanks %>%
  filter(network == "IFAN")

independent_Oxford <- Oxford_give_food_foodbanks %>%
  filter(network == "Independent")

#change mode from interactive to static
tmap_mode("plot")

#plot map
Oxford_map <-
  tm_shape(Oxford_LAs) +
  tm_fill(col = "antiquewhite", alpha = 0.5) +
  tm_borders(col = "black", lwd = 0.1) +
  tm_shape(Oxford_City_LAs) +
  tm_borders(col = "black", lwd = 1) + #bolder border around the City of Oxford
  tm_shape(trussell_Oxford) +
    tm_symbols(col = "purple", size = 0.15) +
  tm_shape(IFAN_Oxford) +
    tm_symbols(col = "orange", size = 0.15) +
  tm_shape(independent_Oxford) +
    tm_symbols(col = "red", size = 0.15) +
  tm_scale_bar(position = c("right", "top")) +
  tm_compass(position = c("right", "top")) +
  tm_layout(legend.outside = TRUE, frame = FALSE,
            main.title = "Other food banks in & around Oxford",
            main.title.position = "centre",
            main.title.size = 0.9) +
  tm_add_legend('symbol',
    col = c("purple", "orange", "red"),
    border.col = "black",
    size = 1,
    labels = c('Trussell',
               'IFAN',
               'Independent'))

Oxford_map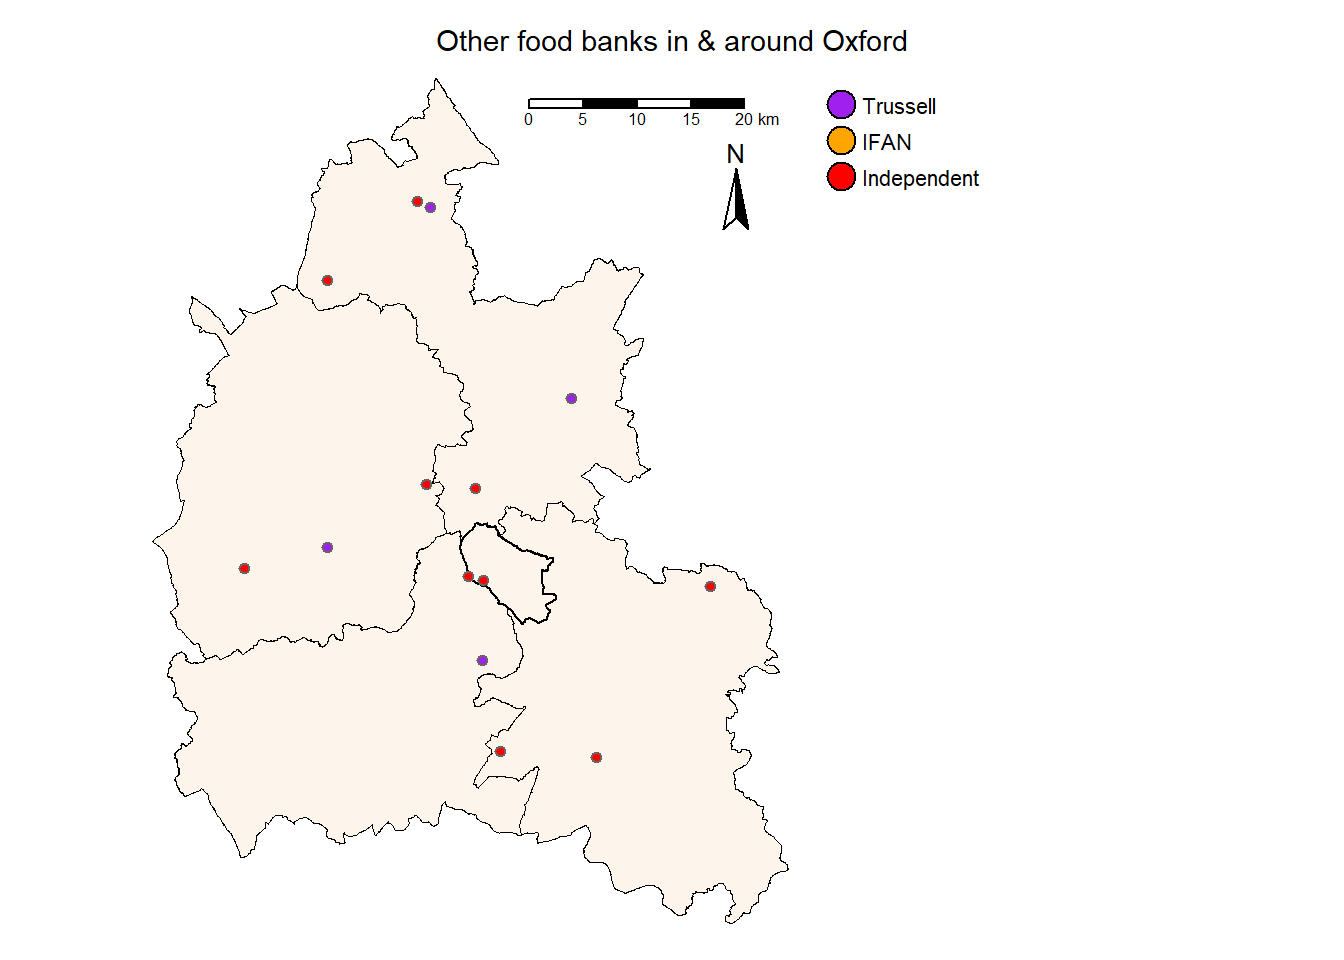
Examining this data informs us that there are more food banks in the area than simply Trussell centres. However, before
#change mode from interactive to static
tmap_mode("plot")

#plot map
Oxford_map <-
  tm_shape(Oxford_LAs) +
  tm_fill(col = "antiquewhite", alpha = 0.5) +
  tm_borders(col = "black", lwd = 0.1) +
  tm_shape(Oxford_City_LAs) +
  tm_borders(col = "black", lwd = 1) +
  tm_shape(Oxford_TT_foodbanks) +
    tm_symbols(col = "purple", size = 0.15) +
  tm_shape(trussell_Oxford) +
    tm_symbols(col = "purple", size = 0.15) +
  tm_shape(IFAN_Oxford) +
    tm_symbols(col = "orange", size = 0.15) +
  tm_shape(independent_Oxford) +
    tm_symbols(col = "red", size = 0.15) +
  tm_scale_bar(position = c("right", "top")) +
  tm_compass(position = c("right", "top")) +
  tm_layout(legend.outside = TRUE, frame = FALSE,
            main.title = "Other food banks in & around Oxford",
            main.title.position = "centre",
            main.title.size = 0.9) +
  tm_add_legend('symbol',
    col = c("purple", "orange", "red"),
    border.col = "black",
    size = 1,
    labels = c('Trussell',
               'IFAN',
               'Independent'))

Oxford_map
5.3 Calculate accessibility for walking, driving, and public transport using r5r package
r5r is an R package for rapid realistic routing on multi-modal transport networks (walk, bike, public transport and car).
To use r5r, we will need:
- A road network data set from OpenStreetMap in .pbf format (mandatory)
- A public transport feed in GTFS.zip format (optional)
- A raster file of Digital Elevation Model data in .tif format (optional)
Link to R package page: https://ipeagit.github.io/r5r/.
Please download the relevant GTFS.zip file for the UK for the public transport timetable data from Mobility Database.
5.3.1 Centroids from LSOAs
First we need to get the point locations for LSOA centroids for Oxford and the surrounding area. You can also download the population weighted centroids for LSOAs, but we are not using those today.
Repeat the filtering process for LSOAs like we did for LAs.
Oxford_LSOAs <- LSOA_2021 %>%
  filter(str_detect(lsoa21nm, "Oxford") |
           str_detect(lsoa21nm, "White Horse") |
           str_detect(lsoa21nm, "Cherwell"))
#change mode from interactive to static
tmap_mode("plot")
#plot map
Oxford_map_LSOAs <-
tm_shape(Oxford_LSOAs) +
tm_fill(col = "white", alpha = 0.5) +
tm_borders(col = "black", lwd = 0.1) +
tm_shape(Oxford_City_LAs) +
tm_borders(col = "black", lwd = 1) +
tm_shape(Oxford_TT_foodbanks) +
tm_symbols(col = "purple", size = 0.15) +
tm_shape(trussell_Oxford) +
tm_symbols(col = "purple", size = 0.15) +
tm_shape(IFAN_Oxford) +
tm_symbols(col = "orange", size = 0.15) +
tm_shape(independent_Oxford) +
tm_symbols(col = "red", size = 0.15) +
tm_scale_bar(position = c("right", "top")) +
tm_compass(position = c("right", "top")) +
tm_layout(legend.outside = TRUE, frame = FALSE,
main.title = "Food bank centres in & around Oxford",
main.title.position = "centre",
main.title.size = 0.9) +
tm_add_legend('symbol',
col = c("purple", "orange", "red"),
border.col = "black",
size = 1,
labels = c('Trussell',
'IFAN',
'Independent'))
Oxford_map_LSOAs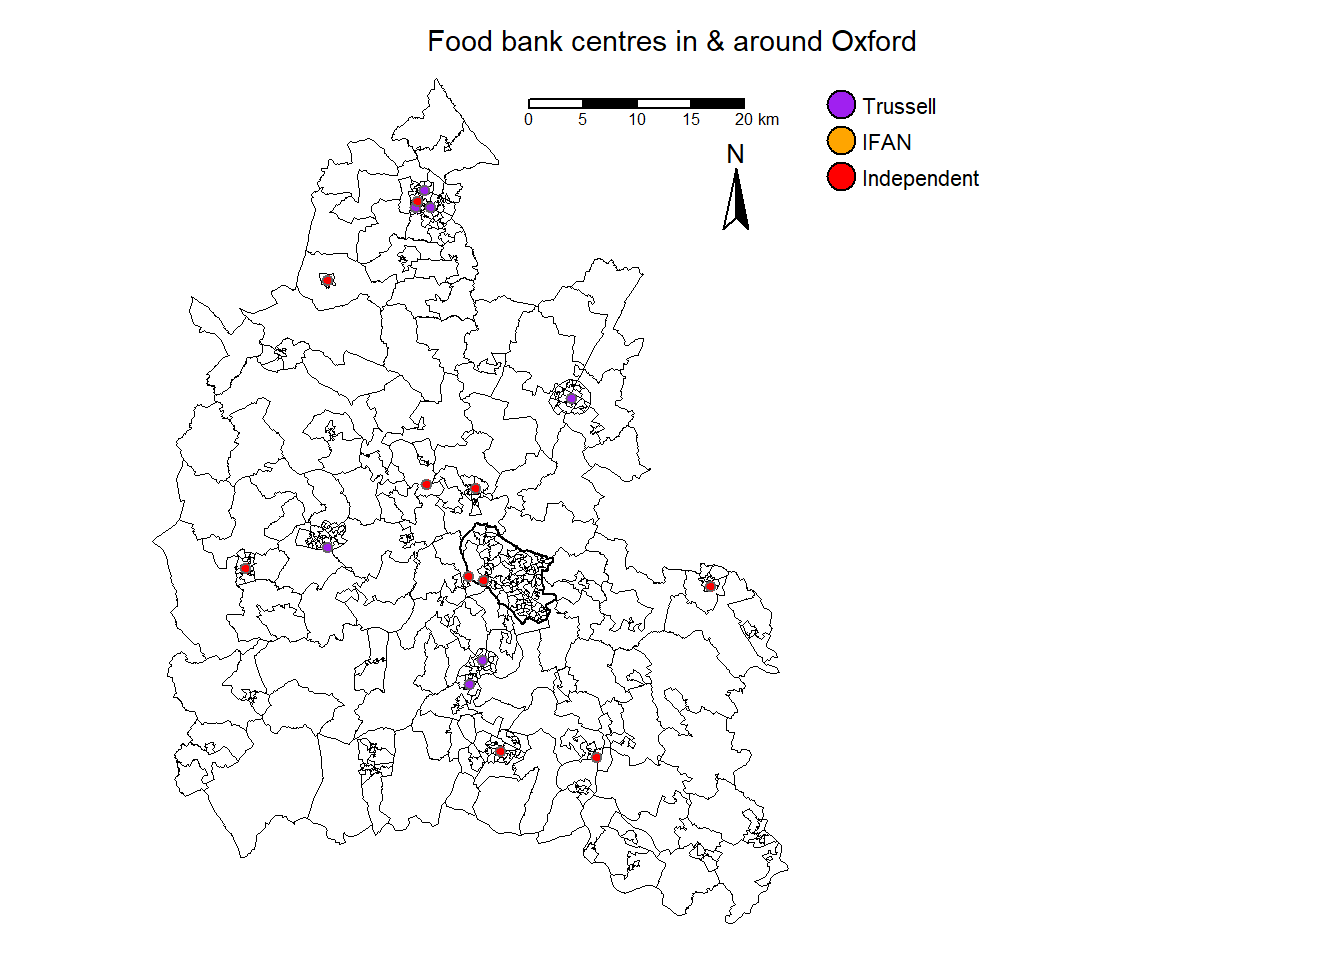
By mapping food bank centres are the LSOA scale rather than the LA scale, we can assume that they are usually located in more densely populated areas like towns/villages in the area.
sf_use_s2(FALSE)

centroids <- st_centroid(Oxford_LSOAs) %>%
  st_transform(.,4326)

centroids <- centroids %>%
  mutate(long = unlist(map(centroids$geometry,1)),
           lat = unlist(map(centroids$geometry,2)))

centroids$key <- 1
centroids$geometry <- NULL

centroids <- centroids %>%
  dplyr::select(lsoa21cd, long, lat, key)
# load in origin locations - LSOA centroids
points_o <- centroids
points_o$lon <- as.numeric(points_o$long)
points_o$lat <- as.numeric(points_o$lat)
points_o$id <- points_o$lsoa21cd
points_o <- points_o[,c("id","lon","lat")]
#look at the data
head(points_o,10) id lon lat
1 E01028422 -1.300924 52.01779
2 E01028423 -1.334394 52.00905
3 E01028426 -1.321150 52.05172
4 E01028427 -1.334637 52.05552
5 E01028428 -1.327504 52.04657
6 E01028429 -1.330818 52.05232
7 E01028430 -1.344268 52.06073
8 E01028431 -1.343978 52.05493
9 E01028432 -1.347226 52.04977
10 E01028433 -1.336181 52.04593Oxford_give_food_foodbanks <- Oxford_give_food_foodbanks %>%
sf::st_transform(crs = 4326)
#unlist geometry column
Oxford_give_food_foodbanks <- Oxford_give_food_foodbanks %>%
mutate(longitude = unlist(map(Oxford_give_food_foodbanks$geometry,1)),
latitude = unlist(map(Oxford_give_food_foodbanks$geometry,2)))
points_d <- Oxford_give_food_foodbanks
points_d$lon <- as.numeric(points_d$longitude)
points_d$lat <- as.numeric(points_d$latitude)
points_d$id <- points_d$postcode
points_d <- points_d[,c("id","lon","lat")]
#look at the data
head(points_d,10)Simple feature collection with 10 features and 3 fields
Geometry type: POINT
Dimension: XY
Bounding box: xmin: -1.595281 ymin: 51.59898 xmax: -1.124697 ymax: 52.06574
Geodetic CRS: WGS 84
id lon lat geometry
1 OX100EW -1.124697 51.59898 POINT (-1.124697 51.59898)
2 OX110BS -1.254187 51.60542 POINT (-1.254187 51.60542)
3 OX141PL -1.276529 51.68172 POINT (-1.276529 51.68172)
4 OX155JS -1.481758 52.00047 POINT (-1.481758 52.00047)
5 OX160AH -1.340658 52.06058 POINT (-1.340658 52.06058)
6 OX160RL -1.358569 52.06574 POINT (-1.358569 52.06574)
7 OX183AG -1.595281 51.75997 POINT (-1.595281 51.75997)
8 OX201RS -1.349959 51.82933 POINT (-1.349959 51.82933)
9 OX201RS -1.349959 51.82933 POINT (-1.349959 51.82933)
10 OX20ES -1.273774 51.74815 POINT (-1.273774 51.74815)The next code chunk downloads the road network for the area. However, for this practical, it is included in the data provided (as is the timetable data for public transport).
# load libraries
#library(r5r)
#https://download.geofabrik.de/europe.html

#osm_lines = oe_get("Oxfordshire", stringsAsFactors = FALSE, quiet = TRUE)
#plot(st_geometry(osm_lines))

#EW_url = oe_match("Oxfordshire")
#oe_download(
  #file_url = EW_url$url,
  #file_size = EW_url$file_size,
  #download_directory = tempdir())

#EW_url[["url"]]
Next we need to set up the r5r core. This sets up the road network and
# increase Java memory
options(java.parameters = "-Xmx6G")

# load libraries
library(r5r)

#path <- system.file("r5r_path", package = "r5r")

r5r_core <- setup_r5(data_path = "prac5_data/.")
For this example, I set the maximum trip duration to 1 hour (60 minutes) and set the departure time at 2pm.
# routing paramaters
mode <- c("TRANSIT")

max_trip_duration <- 60 # minutes

departure_datetime <- as.POSIXct("01-03-2021 14:00:00",
                                 format = "%d-%m-%Y %H:%M:%S",
                                 tz = "Europe/London")

# estimating the travel time
TTM_Oxford_PT <- travel_time_matrix(r5r_core,
                          origins = points_o,
                          destinations = points_d,
                          mode = mode,
                          departure_datetime = departure_datetime,
                          max_trip_duration = max_trip_duration)
# routing paramaters
mode <- c("WALK")
max_trip_duration <- 60 # minutes
departure_datetime <- as.POSIXct("01-03-2021 14:00:00",
format = "%d-%m-%Y %H:%M:%S",
tz = "Europe/London")
# estimating the travel time
TTM_Oxford_walk <- travel_time_matrix(r5r_core,
origins = points_o,
destinations = points_d,
mode = mode,
departure_datetime = departure_datetime,
max_trip_duration = max_trip_duration)# routing paramaters
mode <- c("CAR")
max_trip_duration <- 60 # minutes
departure_datetime <- as.POSIXct("01-03-2021 14:00:00",
format = "%d-%m-%Y %H:%M:%S",
tz = "Europe/London")
# estimating the travel time
TTM_Oxford_drive <- travel_time_matrix(r5r_core,
origins = points_o,
destinations = points_d,
mode = mode,
departure_datetime = departure_datetime,
max_trip_duration = max_trip_duration)We now have three modes of transport (measure of access) to food banks in the area - public transport, walking, and driving. As you can see many more LSOAs have access to a food bank centre within a one hour drive, compared to one hour walking or public transport.
5.3.2 Getting minimum travel time
Let’s start with walking.
#select minimum value between pairs
TTM_Oxford_walk <- TTM_Oxford_walk %>%
  group_by(to_id, from_id) %>%
  slice(which.min(travel_time_p50))

#check travel times as numeric
TTM_Oxford_walk$travel_time_p50 <- as.numeric(TTM_Oxford_walk$travel_time_p50)
This removes origin-destination pairs that have two or more values for travel time under one hour
#pivot wider
TTM_Oxford_walk <- TTM_Oxford_walk %>%
  pivot_wider(names_from = to_id, values_from = travel_time_p50)

head(TTM_Oxford_walk)
# A tibble: 6 × 15
# Groups: from_id [6]
from_id OX100EW OX110BS OX141PL OX155JS OX160AH OX160RL OX183AG OX201RS OX20ES
<chr> <dbl> <dbl> <dbl> <dbl> <dbl> <dbl> <dbl> <dbl> <dbl>
1 E01028… 47 NA NA NA NA NA NA NA NA
2 E01028… 47 NA NA NA NA NA NA NA NA
3 E01028… 36 NA NA NA NA NA NA NA NA
4 E01028… 22 NA NA NA NA NA NA NA NA
5 E01028… 16 NA NA NA NA NA NA NA NA
6 E01028… 7 NA NA NA NA NA NA NA NA
# ℹ 5 more variables: OX20LX <dbl>, OX266JU <dbl>, OX284YG <dbl>, OX52DS <dbl>,
# OX93UH <dbl>The number of rows has decreased as not all LSOAs will have accessibility to a centre within one hour. Let’s repeat this for driving and public transport.
#select minimum value between pairs
TTM_Oxford_drive <- TTM_Oxford_drive %>%
  group_by(to_id, from_id) %>%
  slice(which.min(travel_time_p50))

#check travel times as numeric
TTM_Oxford_drive$travel_time_p50 <- as.numeric(TTM_Oxford_drive$travel_time_p50)

#pivot wider to create a matrix
TTM_Oxford_drive <- TTM_Oxford_drive %>%
  pivot_wider(names_from = to_id, values_from = travel_time_p50)

head(TTM_Oxford_drive)
# A tibble: 6 × 15
# Groups: from_id [6]
from_id OX100EW OX110BS OX141PL OX155JS OX160AH OX160RL OX183AG OX201RS OX20ES
<chr> <dbl> <dbl> <dbl> <dbl> <dbl> <dbl> <dbl> <dbl> <dbl>
1 E01028… 52 48 37 17 8 14 41 21 32
2 E01028… 53 49 38 15 13 19 42 22 33
3 E01028… 59 55 44 22 6 12 48 28 39
4 E01028… 57 53 42 21 4 10 46 26 37
5 E01028… 57 52 41 21 7 13 45 25 36
6 E01028… 58 54 42 21 5 11 47 27 38
# ℹ 5 more variables: OX20LX <dbl>, OX266JU <dbl>, OX284YG <dbl>, OX52DS <dbl>,
# OX93UH <dbl>#select minimum value between pairs
TTM_Oxford_PT <- TTM_Oxford_PT %>%
group_by(to_id, from_id) %>%
slice(which.min(travel_time_p50))
#check travel times as numeric
TTM_Oxford_PT$travel_time_p50 <- as.numeric(TTM_Oxford_PT$travel_time_p50)
#pivot wider to create a matrix
TTM_Oxford_PT <- TTM_Oxford_PT %>%
pivot_wider(names_from = to_id, values_from = travel_time_p50)
head(TTM_Oxford_PT)# A tibble: 6 × 15
# Groups: from_id [6]
from_id OX100EW OX110BS OX141PL OX155JS OX160AH OX160RL OX183AG OX201RS OX20ES
<chr> <dbl> <dbl> <dbl> <dbl> <dbl> <dbl> <dbl> <dbl> <dbl>
1 E01028… 47 NA NA NA NA NA NA NA NA
2 E01028… 47 NA NA NA NA NA NA NA NA
3 E01028… 36 NA NA NA NA NA NA NA NA
4 E01028… 22 NA NA NA NA NA NA NA NA
5 E01028… 16 NA NA NA NA NA NA NA NA
6 E01028… 7 NA NA NA NA NA NA NA NA
# ℹ 5 more variables: OX20LX <dbl>, OX266JU <dbl>, OX284YG <dbl>, OX52DS <dbl>,
# OX93UH <dbl>Now we have the accessibility data in a usable form that we can join to our Oxford LSOAs data frame, we can calculate mean and minimum travel times for each LSOA for each mode of transport.
#mean time
TTM_Oxford_drive$mean_time_drive <- rowMeans(TTM_Oxford_drive[,c(2:15)], na.rm = TRUE)

TTM_Oxford_PT$mean_time_PT <- rowMeans(TTM_Oxford_PT[,c(2:15)], na.rm = TRUE)

TTM_Oxford_walk$mean_time_walk <- rowMeans(TTM_Oxford_walk[,c(2:15)], na.rm = TRUE)

#minimum time
TTM_Oxford_drive$minimum_time_drive <- apply(TTM_Oxford_drive, 1, FUN=min, na.rm = TRUE)

TTM_Oxford_PT$minimum_time_PT <- apply(TTM_Oxford_PT, 1, FUN=min, na.rm = TRUE)

TTM_Oxford_walk$minimum_time_walk <- apply(TTM_Oxford_walk, 1, FUN=min, na.rm = TRUE)
#change minimum times to numeric
TTM_Oxford_drive$minimum_time_drive <- as.numeric(TTM_Oxford_drive$minimum_time_drive)
TTM_Oxford_PT$minimum_time_PT <- as.numeric(TTM_Oxford_PT$minimum_time_PT)
TTM_Oxford_walk$minimum_time_walk <- as.numeric(TTM_Oxford_walk$minimum_time_walk)Now we need to join this to the Oxford LSOAs dataframe and map it.
#rename to from id columns for joining purposes
#select only the ID column and mean and minimum times

TTM_Oxford_drive <- TTM_Oxford_drive %>%
  select(from_id, mean_time_drive, minimum_time_drive) %>%
  rename(., lsoa21cd = "from_id")

TTM_Oxford_walk <- TTM_Oxford_walk %>%
  select(from_id, mean_time_walk, minimum_time_walk) %>%
  rename(., lsoa21cd = "from_id")

TTM_Oxford_PT <- TTM_Oxford_PT %>%
  select(from_id, mean_time_PT, minimum_time_PT) %>%
  rename(., lsoa21cd = "from_id")

Oxford_LSOAs <- Oxford_LSOAs %>%
  left_join(.,
            TTM_Oxford_drive,
            by = "lsoa21cd") %>%
  left_join(.,
            TTM_Oxford_walk,
            by = "lsoa21cd") %>%
  left_join(.,
            TTM_Oxford_PT,
            by = "lsoa21cd")
#map for minimum public transport time
Travel_time_map <-
tm_shape(Oxford_LSOAs) +
tm_fill(col = "minimum_time_PT", title = "Minimum time to food bank (mins)", style = "cont", n=10, palette = "-Spectral",
colorNA = "white", # colour of missing data
textNA = "Public transport beyond one hour") +
tm_borders(col = "grey", lwd = 0.01) +
tm_shape(Oxford_LAs) +
tm_borders(col = "black", lwd = 1) +
tm_shape(Oxford_City_LAs) +
tm_borders(col = "black", lwd = 1) +
tm_scale_bar(position = c("right", "top")) +
tm_compass(position = c("right", "top")) +
tm_layout(legend.outside = TRUE, frame = FALSE,
main.title = "PT accessibility in & around Oxford",
main.title.position = "centre",
main.title.size = 0.9)
Travel_time_map 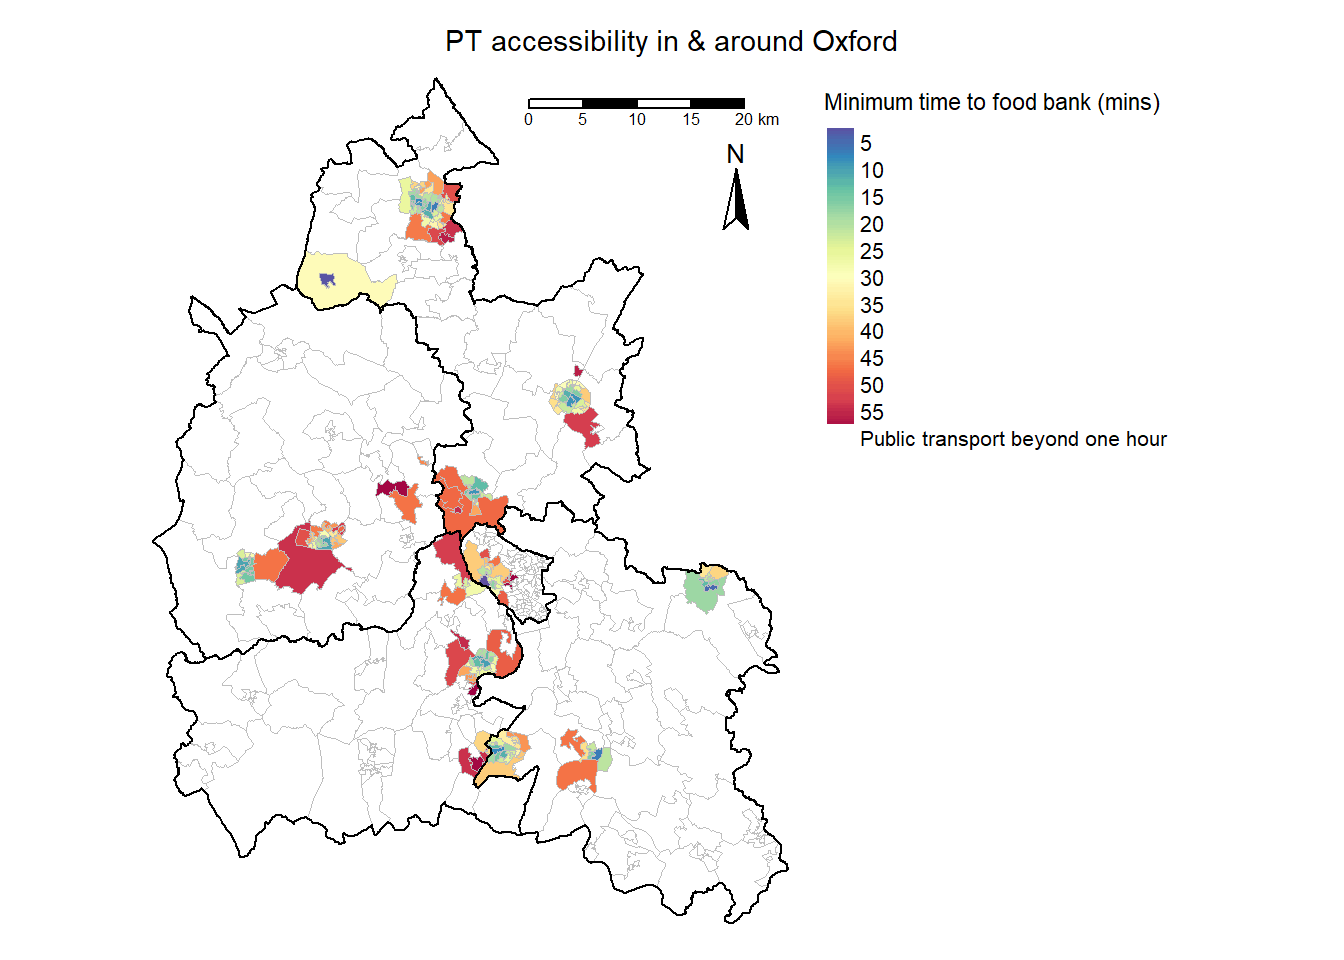
#map for minimum driving time
Travel_time_map <-
  tm_shape(Oxford_LSOAs) +
  tm_fill(col = "minimum_time_drive", title = "Minimum time to food bank (mins)", style = "cont", n=10, palette = "-Spectral",
          colorNA = "white", # colour of missing data
          textNA = "Driving beyond one hour") +
    tm_borders(col = "grey", lwd = 0.01) +
  tm_shape(Oxford_LAs) +
    tm_borders(col = "black", lwd = 1) +
  tm_shape(Oxford_City_LAs) +
    tm_borders(col = "black", lwd = 1) +
  tm_scale_bar(position = c("right", "top")) +
  tm_compass(position = c("right", "top")) +
  tm_layout(legend.outside = TRUE, frame = FALSE,
            main.title = "Driving accessibility in & around Oxford",
            main.title.position = "centre",
            main.title.size = 0.9)

Travel_time_map 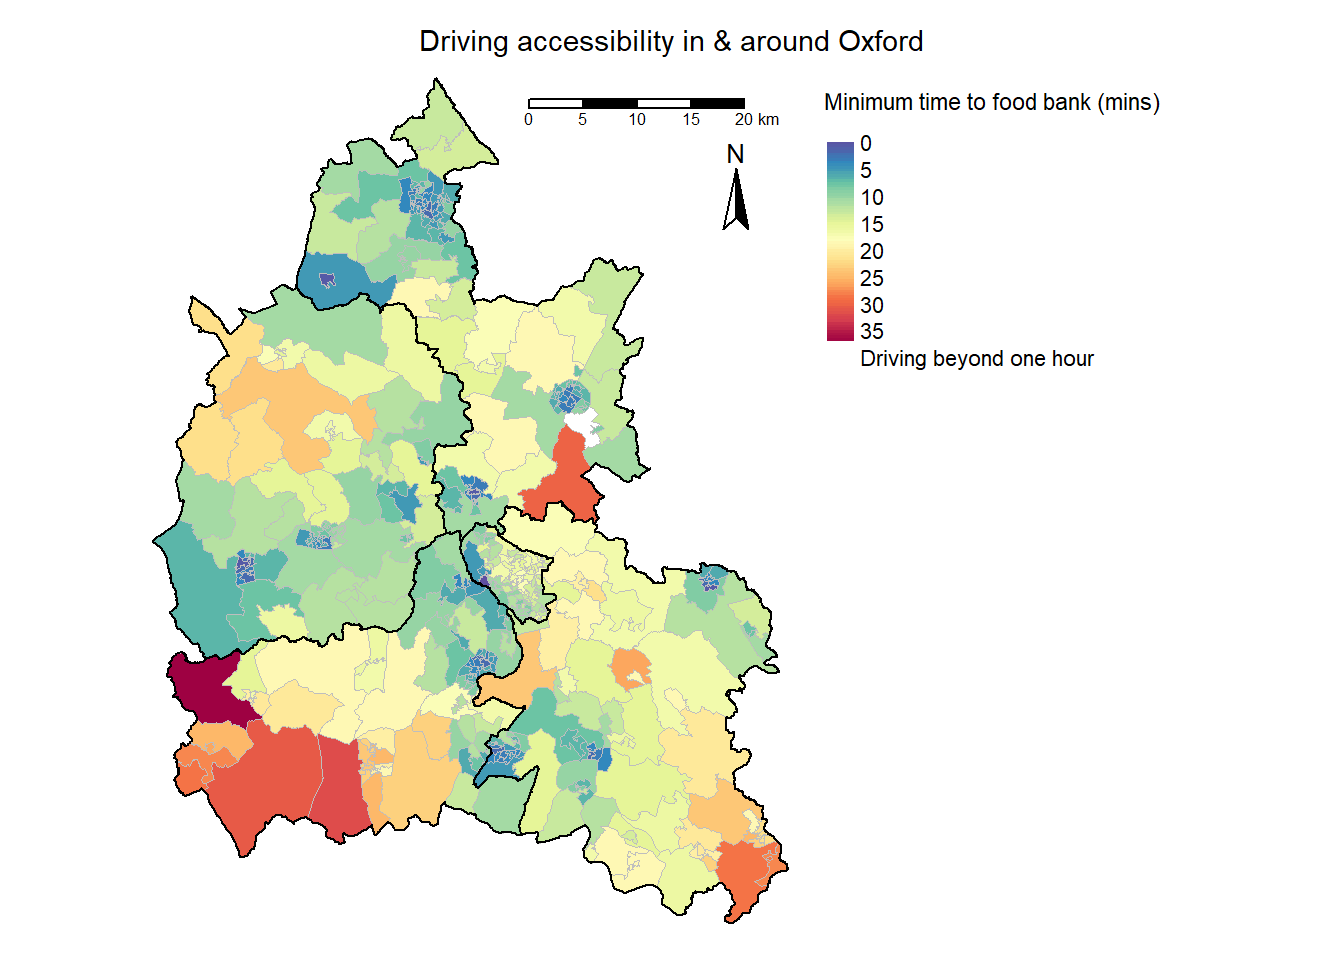
#map for minimum walking time
Travel_time_map <-
  tm_shape(Oxford_LSOAs) +
  tm_fill(col = "minimum_time_walk", title = "Minimum time to food bank (mins)", style = "cont", n=10, palette = "-Spectral",
          colorNA = "white", # colour of missing data
          textNA = "Walking beyond one hour") +
    tm_borders(col = "grey", lwd = 0.01) +
  tm_shape(Oxford_LAs) +
    tm_borders(col = "black", lwd = 1) +
  tm_shape(Oxford_City_LAs) +
    tm_borders(col = "black", lwd = 1) +
  tm_scale_bar(position = c("right", "top")) +
  tm_compass(position = c("right", "top")) +
  tm_layout(legend.outside = TRUE, frame = FALSE,
            main.title = "Walking accessibility in & around Oxford",
            main.title.position = "centre",
            main.title.size = 0.9)

Travel_time_map 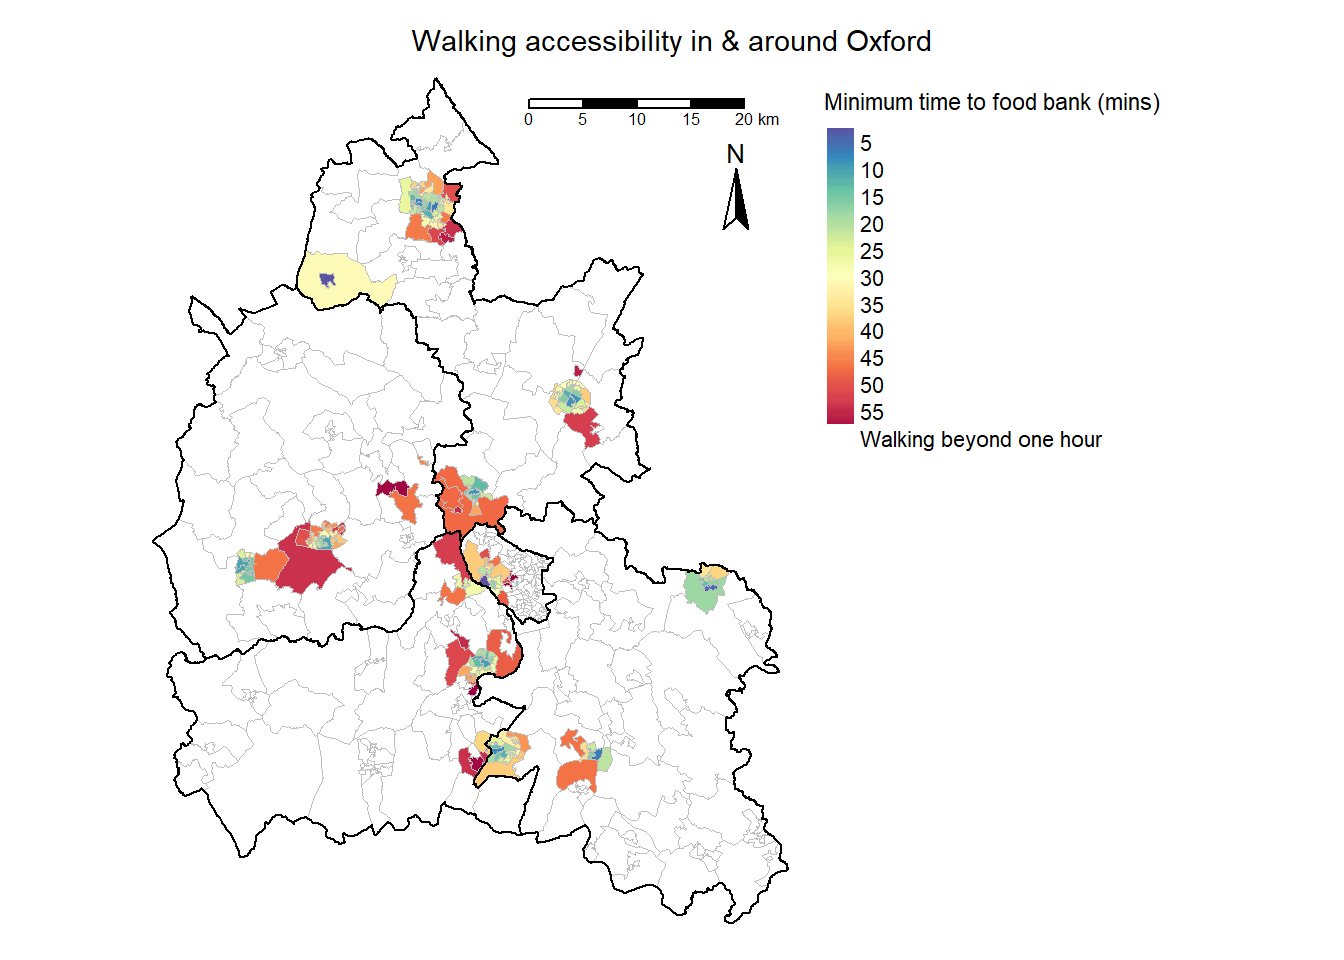
From these three maps it is very clear that areas have unequal access to food bank centres, especially in the rural parts of Oxfordshire. However, do people in these areas of low accessibility need greater access to centres.
5.4 Examining demand
In this last section we will examine two determinants of food bank use. Let’s take housing tenure (socially rented homes) and disability. This is census data from 2021 at the LSOA scale.
#Type of tenure of housing
Tenure <- read_csv("prac5_data/Tenure.csv") %>%
  clean_names() %>%
  separate(lsoa21cd, c('lsoa_code', 'lsoa_name'), sep = ':') %>%
  mutate(lsoa_name = trimws(lsoa_name)) %>%
  mutate(lsoa_code = trimws(lsoa_code))

#select socially rented variable
Tenure <- Tenure %>%
  select(lsoa_code, lsoa_name, social_rented)

#households that are socially rented
Tenure$social_rented <- as.numeric(Tenure$social_rented)
favstats(Tenure$social_rented)
min Q1 median Q3 max mean sd n missing
0 4.6 11.4 24.9 92 16.90616 15.9975 35672 7#social rented
ggplot(Tenure,
aes(x=social_rented)) +
geom_histogram(aes(y=after_stat(density)), color="black", fill="white") +
geom_vline(aes(xintercept=mean(social_rented)),
color="blue", linetype="dashed", size=1) +
geom_density(alpha=.2, fill="#FF6666")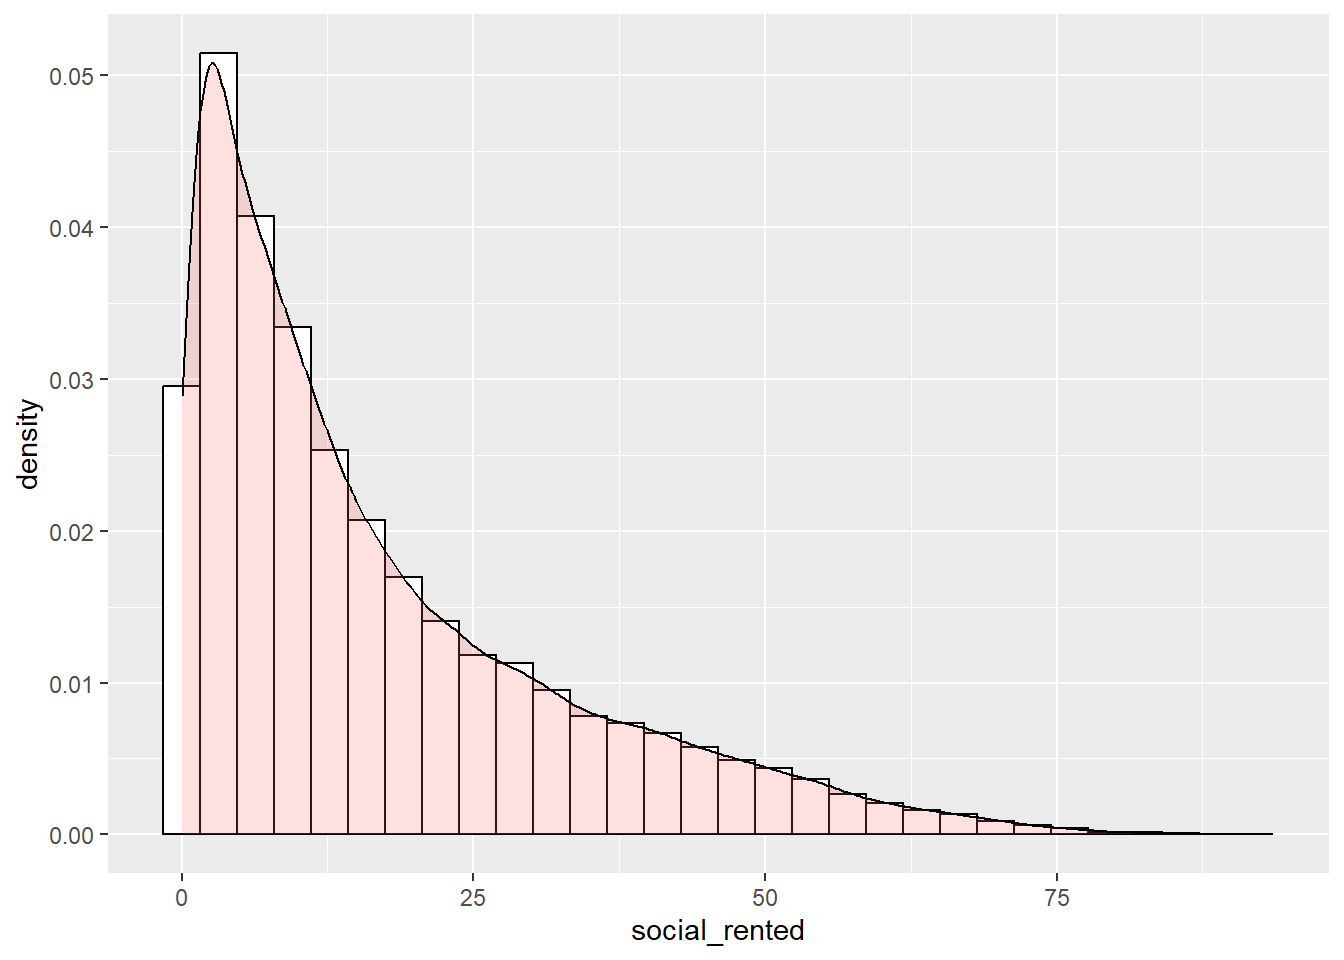
#Disability under the Equality Act
Disability <- read_csv("prac5_data/Disability.csv") %>%
  clean_names() %>%
  separate(lsoa, c('lsoa_code', 'lsoa_name'), sep = ':') %>%
  mutate(lsoa_name = trimws(lsoa_name)) %>%
  mutate(lsoa_code = trimws(lsoa_code))

#select socially rented variable
Disability <- Disability %>%
  select(lsoa_code, lsoa_name, disabled_under_the_equality_act)

#households with 1+ disabled person
Disability$disabled_under_the_equality_act <- as.numeric(Disability$disabled_under_the_equality_act)
favstats(Disability$disabled_under_the_equality_act)
min Q1 median Q3 max mean sd n missing
1.8 14.1 17.2 20.9 44.7 17.71969 4.931695 35672 7#disability
ggplot(Disability,
aes(x=disabled_under_the_equality_act)) +
geom_histogram(aes(y=after_stat(density)), color="black", fill="white") +
geom_vline(aes(xintercept=mean(disabled_under_the_equality_act)),
color="blue", linetype="dashed", size=1) +
geom_density(alpha=.2, fill="#FF6666") 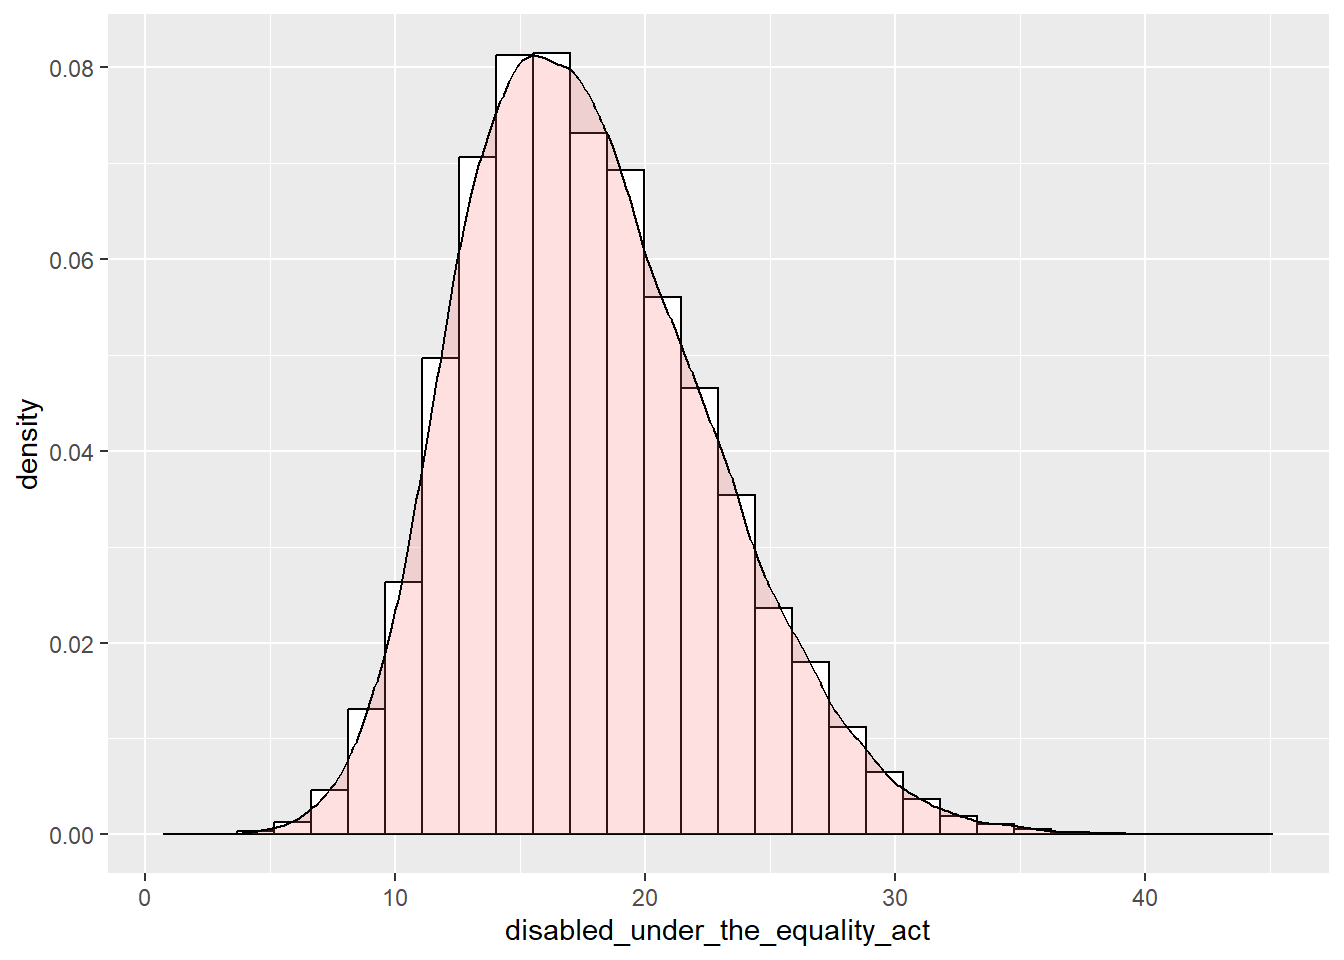
Note
Question:
What can we say about the distribution of these two demand variables? And how could we customise these histograms to improve the look of them?
#rename lsoa code variable
Disability <- Disability %>%
rename(., "lsoa21cd" = "lsoa_code") %>%
rename(., "lsoa21nm" = "lsoa_name")
Tenure <- Tenure %>%
rename(., "lsoa21cd" = "lsoa_code") %>%
rename(., "lsoa21nm" = "lsoa_name")
#join to Oxford LSOA data frame
Oxford_LSOAs <- Oxford_LSOAs %>%
left_join(.,
Disability,
by = "lsoa21cd") %>%
left_join(.,
Tenure,
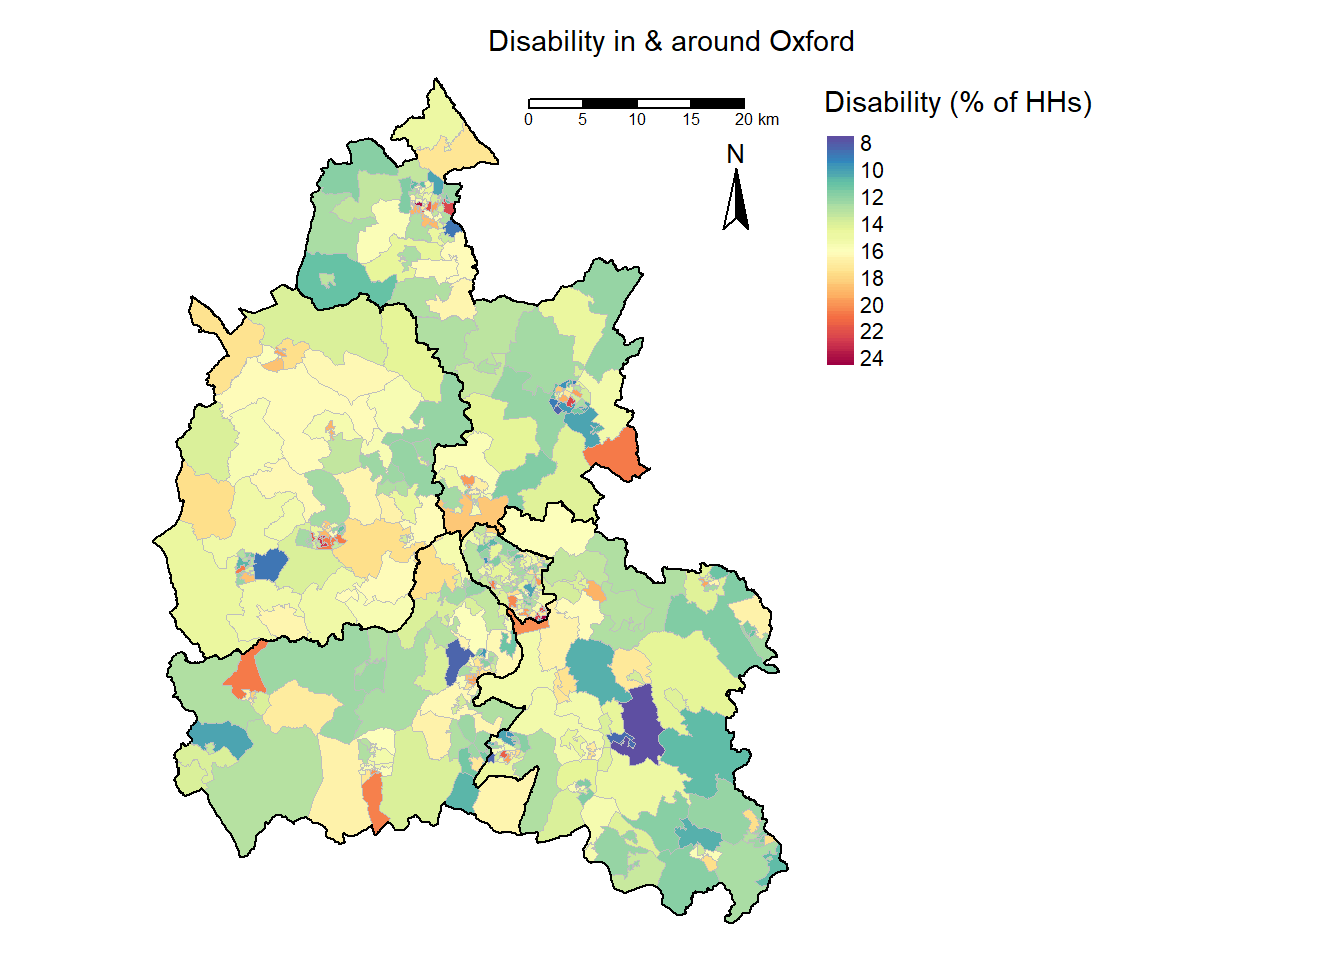
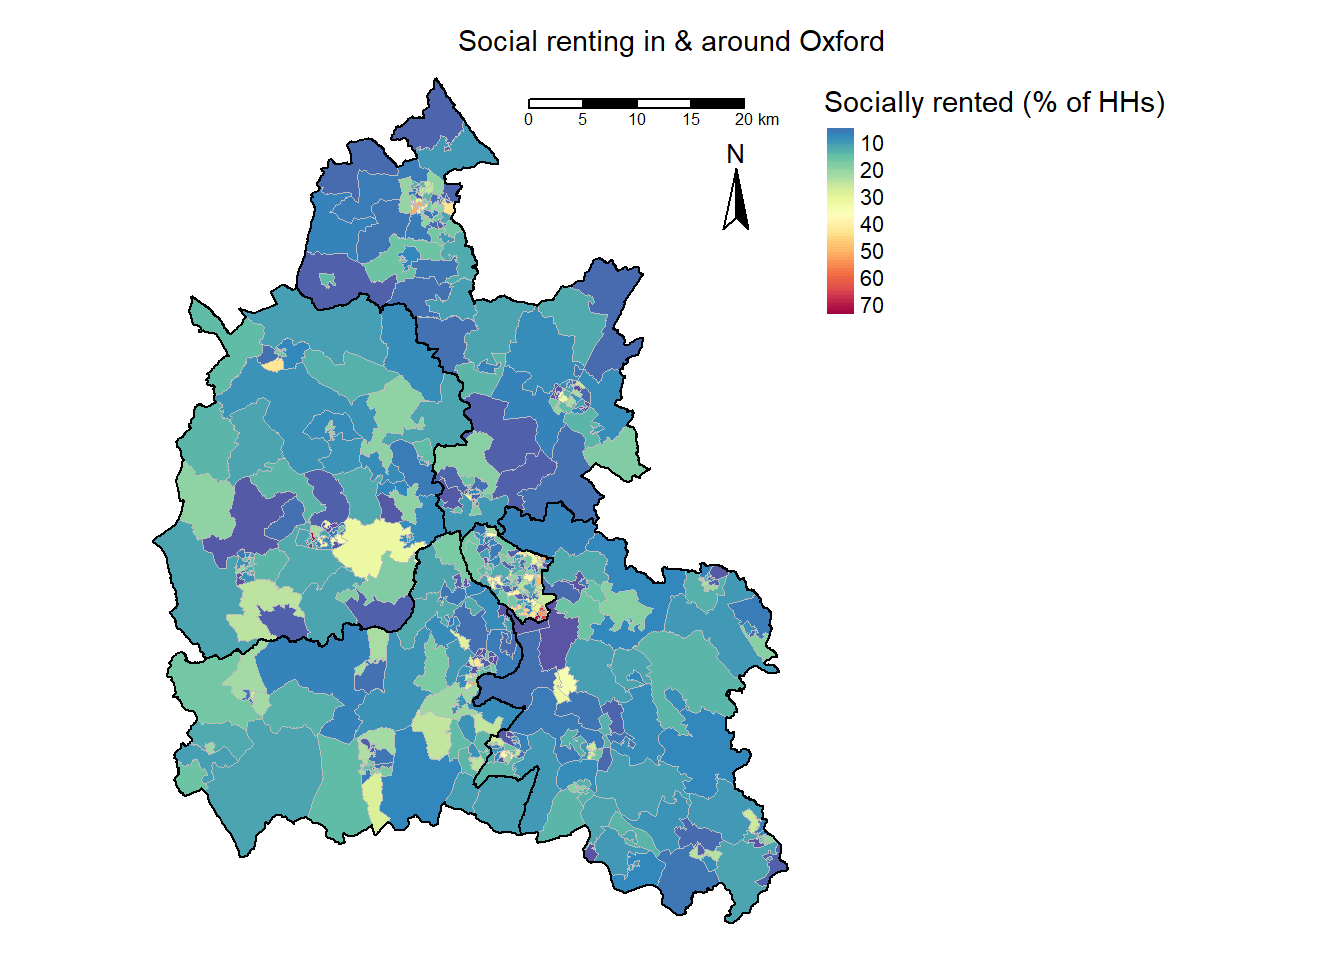
by = "lsoa21cd")Let’s make a map of disability (% of households with one or more disabled person living there) and socially rented homes.
5.4.1 Identifying under-served areas
Firstly, what are the national averages for disability and social renting across England and Wales?
mean(Tenure$social_rented, na.rm = TRUE)[1] 16.90616mean(Disability$disabled_under_the_equality_act, na.rm = TRUE)[1] 17.71969- Socially renting - 16.9% of households
- Disability - 17.7% of households
And what are the Oxford and surrounding area averages?
mean(Oxford_LSOAs$social_rented, na.rm = TRUE)[1] 14.51145mean(Oxford_LSOAs$disabled_under_the_equality_act, na.rm = TRUE)[1] 14.61028- Socially renting - 14.5% of households
- Disability - 14.6% of households
They are lower than the national averages.
Let’s take a look for the three travel times too.
mean(Oxford_LSOAs$mean_time_drive, na.rm = TRUE)[1] 31.85707mean(Oxford_LSOAs$mean_time_walk, na.rm = TRUE)[1] 32.2356mean(Oxford_LSOAs$mean_time_PT, na.rm = TRUE)[1] 32.2356Very simply, if we take the areas that are below the area average for social renting and disability and one of the accessibility measures, which places in and around Oxford are under served to food banks based on high demand and lower accessibility?
#set some parameters to identify which areas are under served
Oxford_LSOAs <- Oxford_LSOAs %>%
  mutate(Underserved_areas = case_when
         (social_rented >= 14.5 & disabled_under_the_equality_act >= 14.6 & mean_time_walk >= 32 ~ "Underserved",
        TRUE ~ "Served"))
#creating a buffer around the LSOAs
buffer <- Oxford_LSOAs %>%
filter(Underserved_areas == "Underserved") %>%
st_buffer(., 500) %>%
st_union()
Underserved_map <-
tm_shape(Oxford_LSOAs) +
tm_fill(col = "Underserved_areas", style = "cont", title = "Underserved Areas", palette = "Blues") +
tm_borders(col = "grey", lwd = 0.1) +
tm_shape(buffer) +
tm_polygons(alpha = 0.1) +
tm_shape(Oxford_LAs) +
tm_borders(col = "black", lwd = 1) +
tm_shape(Oxford_City_LAs) +
tm_borders(col = "black", lwd = 1) +
tm_scale_bar(position = c("right", "top")) +
tm_compass(position = c("right", "top")) +
tm_layout(main.title = "Under-served areas to food banks", main.title.position = "centre",
legend.outside = TRUE, frame = FALSE, main.title.size = 1)
Underserved_map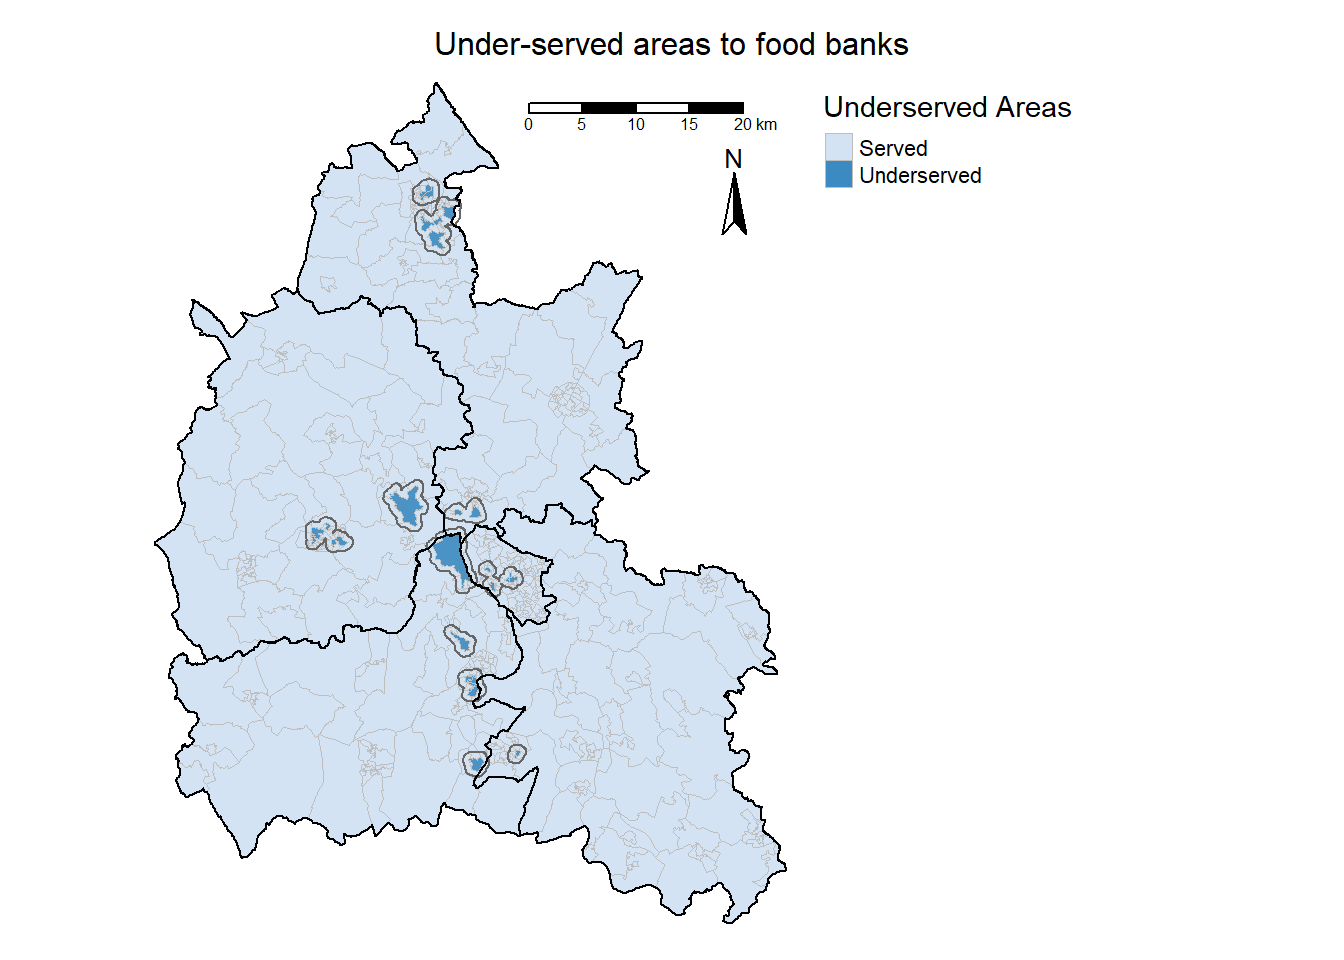
5.5 Quick summary
We can use accessibility tools and census data to assess where in an area is under-served to particular services.
- How would we improve this analysis?
- What are the limitations of the data used?
- How could we improve the visualisations?