1 Spatial data
1.1 Spatial data
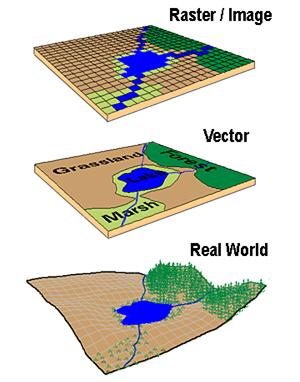
Geographic data, geospatial data or geographic information is data that identifies the location of features on Earth. There are two main types of data which are used in GIS applications to represent the real world.
Vectors that are composed of points, lines and polygons
Rasters that are grids of cells with individual values…

1.2 Projections
Spatial data is special as it must have a coordinate reference system (CRS) often referred to as a projection.
These are mathematical formulas that specify how our data is represented on a map. > How would you represent the globe on a 2D paper map, screen or sphere?
Projections can either be geographic coordinate reference systems or projected coordinate reference systems. The former treats data as a sphere and the latter as a flat object. You might come across phrases such as a resolution of 5 minutes or a resolution of 30 metres, which can be used to establish what kind of projection system has been used. Let me explain…
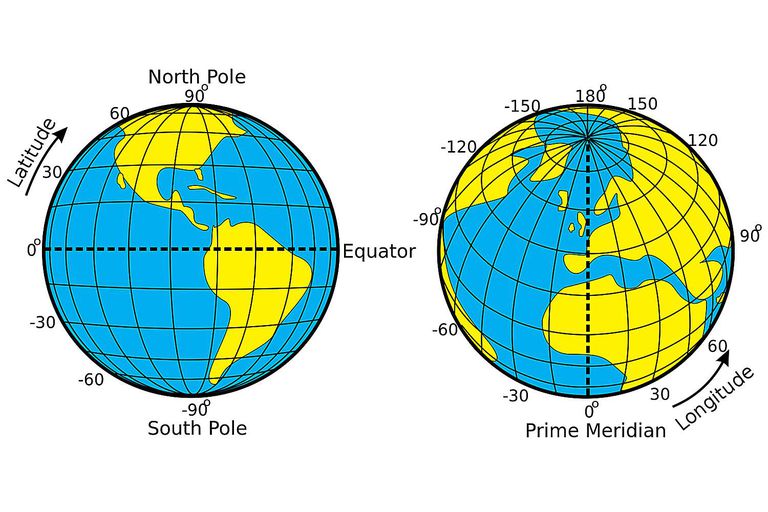
A minute type of resolution (e.g. 5 minute resolution) is a geographic reference system that treats the globe as if it was a sphere divided into 360 equal parts called degrees (which are angular units). Each degree has 60 minutes and each minute has 60 seconds. Arc-seconds of latitude (horizontal lines in the globe figure below) remain almost constant whilst arc-seconds of longitude (vertical lines in the globe figure below) decrease in a trigonometric cosine-based fashion as you move towards the Earth’s poles.

This causes problems as you increase or decrease latitude the longitudinal lengths alter…For example at the equator (0°, such as Quito) a degree is 111.3 km whereas at 60° (such as Saint Petersburg) a degree is 55.80 km…
In contrast a projected coordinate system is defined on a flat, two-dimensional plane (through projecting a spheroid onto a 2D surface) giving it constant lengths, angles and are…


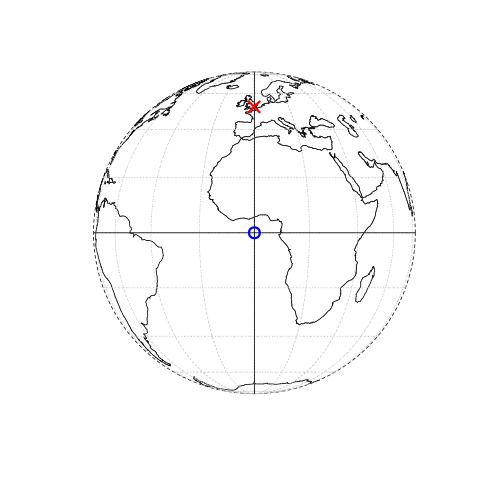
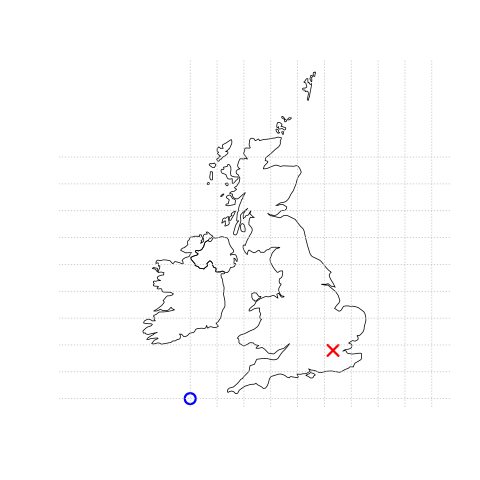
Knowing this, if we want to conduct analysis locally (e.g. at a national level) or use metric (e.g. kilometres) measurements we need to be able to change the projection of our data or “reproject” it. Most countries and even states have their own projected coordinate reference system such as British National Grid in the above example…Note how the origin (0,0) is has moved from the centre of the Earth to the bottom South West corner of the UK, which has now been ironed (or flattened) out.
1.3 Questions we can ask
The real benefit of spatial data is that we can see where trends happen….
Examples of questions include:
Are the pharmacies distributed randomly or do they exhibit some kind of dispersed or clustered pattern?
What factors influence evictions in a city (e.g. New York)?
Are the values (e.g. income / deprivation) similar (or dissimilar) across the areas of a city?
What are the factors that might lead to variation in Average GCSE (secondary school grades) point scores across the city?
Is there racial bias in stop question and frisk data?
What population does a hospital / school / social service cover ?
If we were to develop a new facility (e.g. hospital, school, pharmacy) where would it reduce demand the most given some candidate sites ?
What factors influence perceived safety in the built envrionment?