Reproducible geographical information Systems and Science
What led me here?
- Lecture with Carl Howe
2017, 90% of the data in the world today has been created in the last two years alone, at 2.5 quintillion bytes of data a day! - IBM

Data is often misrepresented….
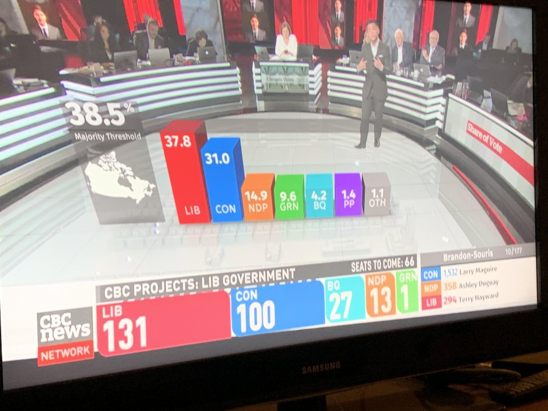


Who has manipulated our boundary data?
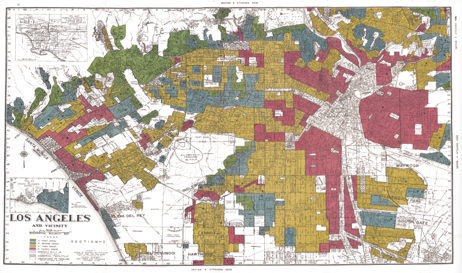
Redlining
- 1930s – American Home Owner’s Loan Corporation – prevent missed payments…residential security maps based on race
- People abandon redlined areas
- Can’t refinance
- Less property tax for services
Who has manipulated our boundary data?
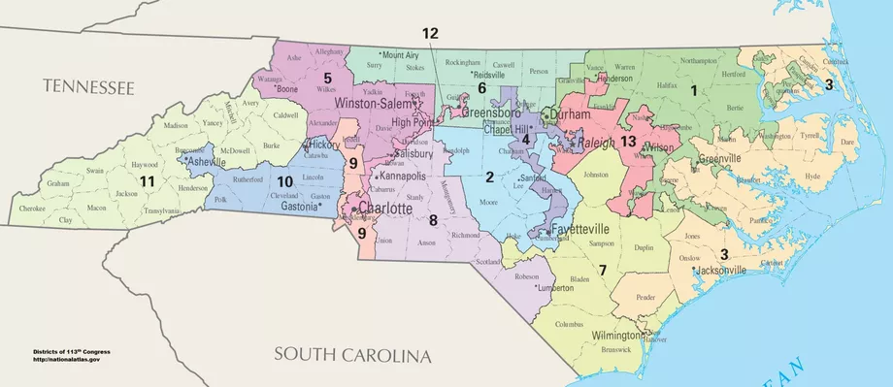
Gerrymandering
Every 10 years electoral districts are re-drawn “redistricting”– Thomas Hofeller (republican) = PACK and CRACK
- PACK = put all the democrat voters in 1 district
- CRACK = sprinkle them out so they never have majority
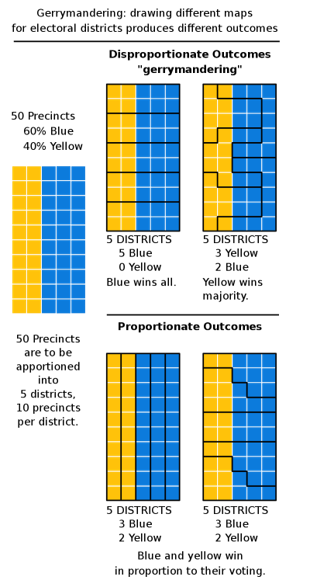

“Redistricting is democracy at work” - Tom Hofeller

Lead by example
Traditional labs and were distributed in pdfs, word documents and powerpoints.
Used ArcGIS 💰
![]()
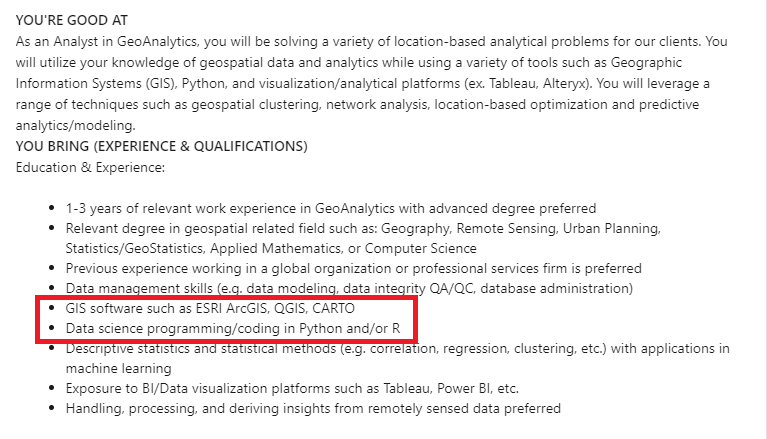
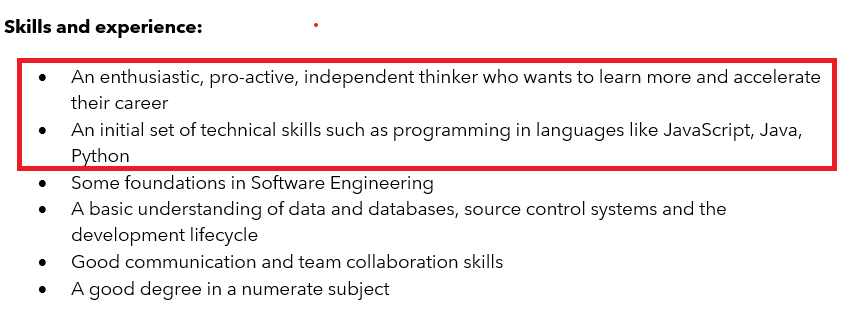
1b. Listen to Alumni / employers

1c. Design and output
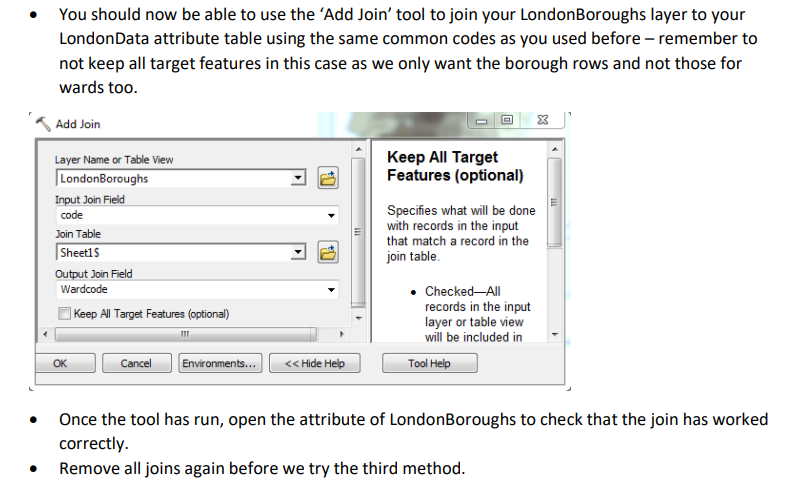
Part 1: GIS tools…
You need calculate the average percent of science students (in all) grades per county meeting the required standards and produce a map to show where the Country averages are above or below the State of Washington average.
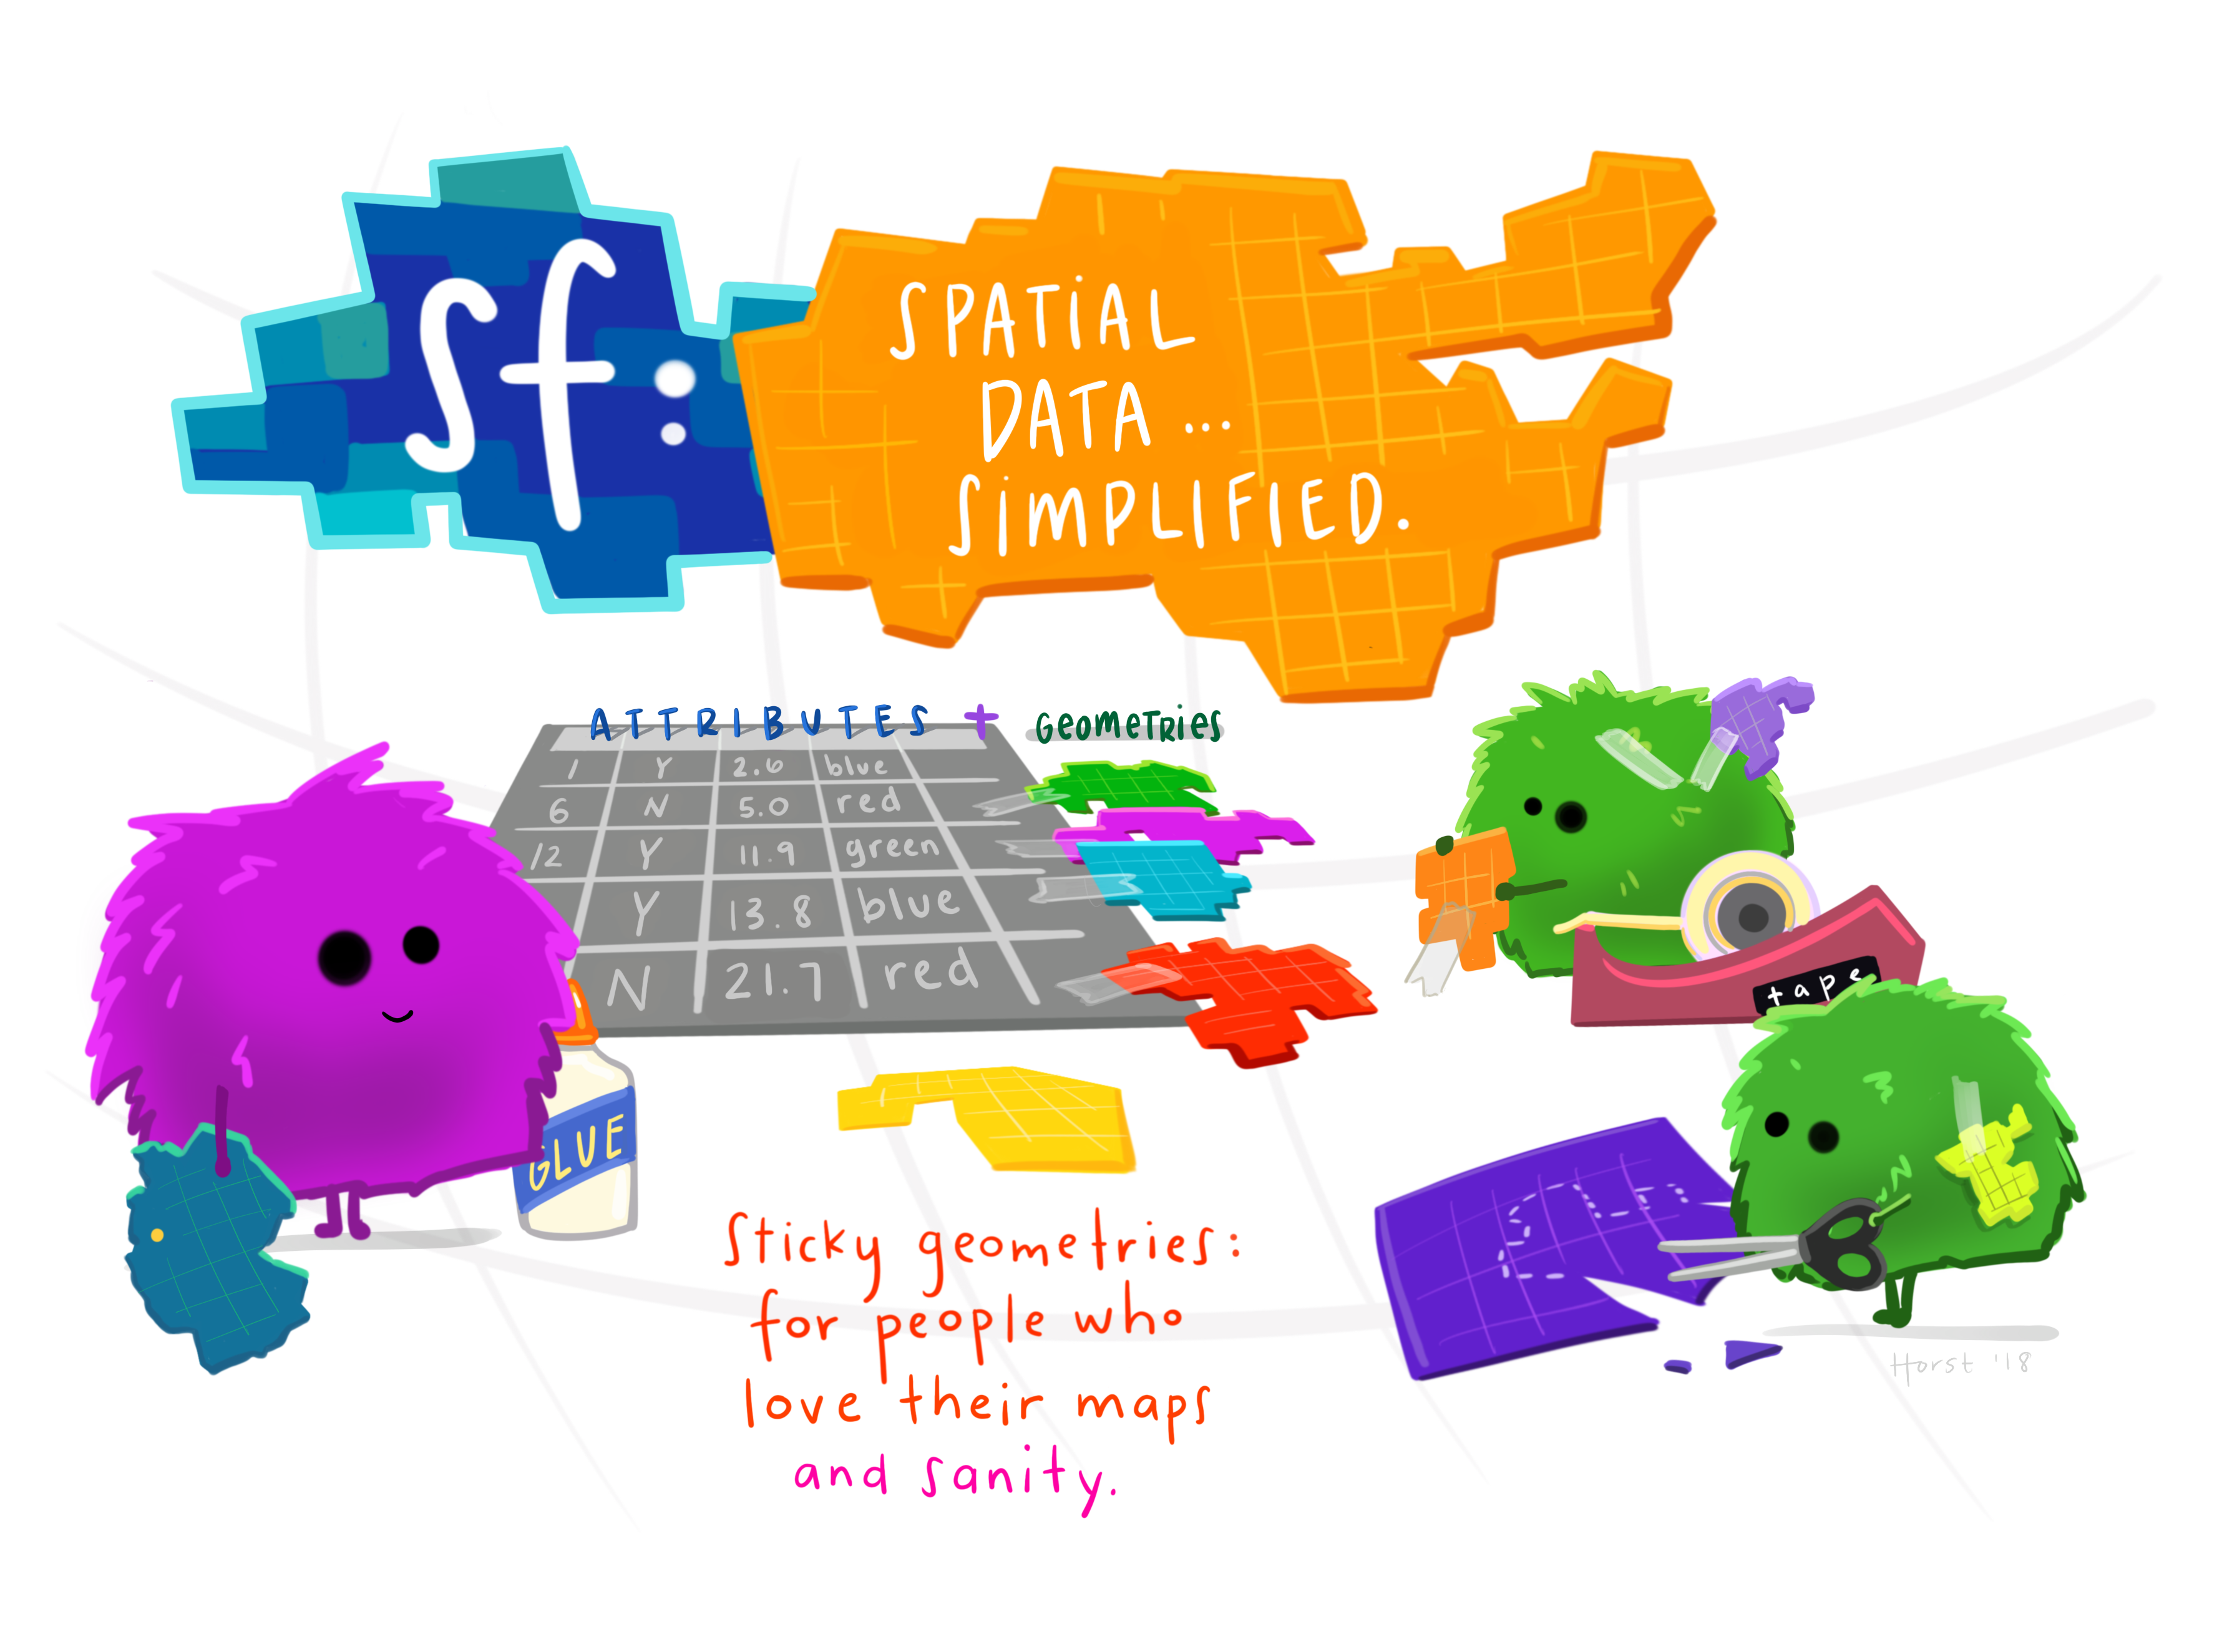
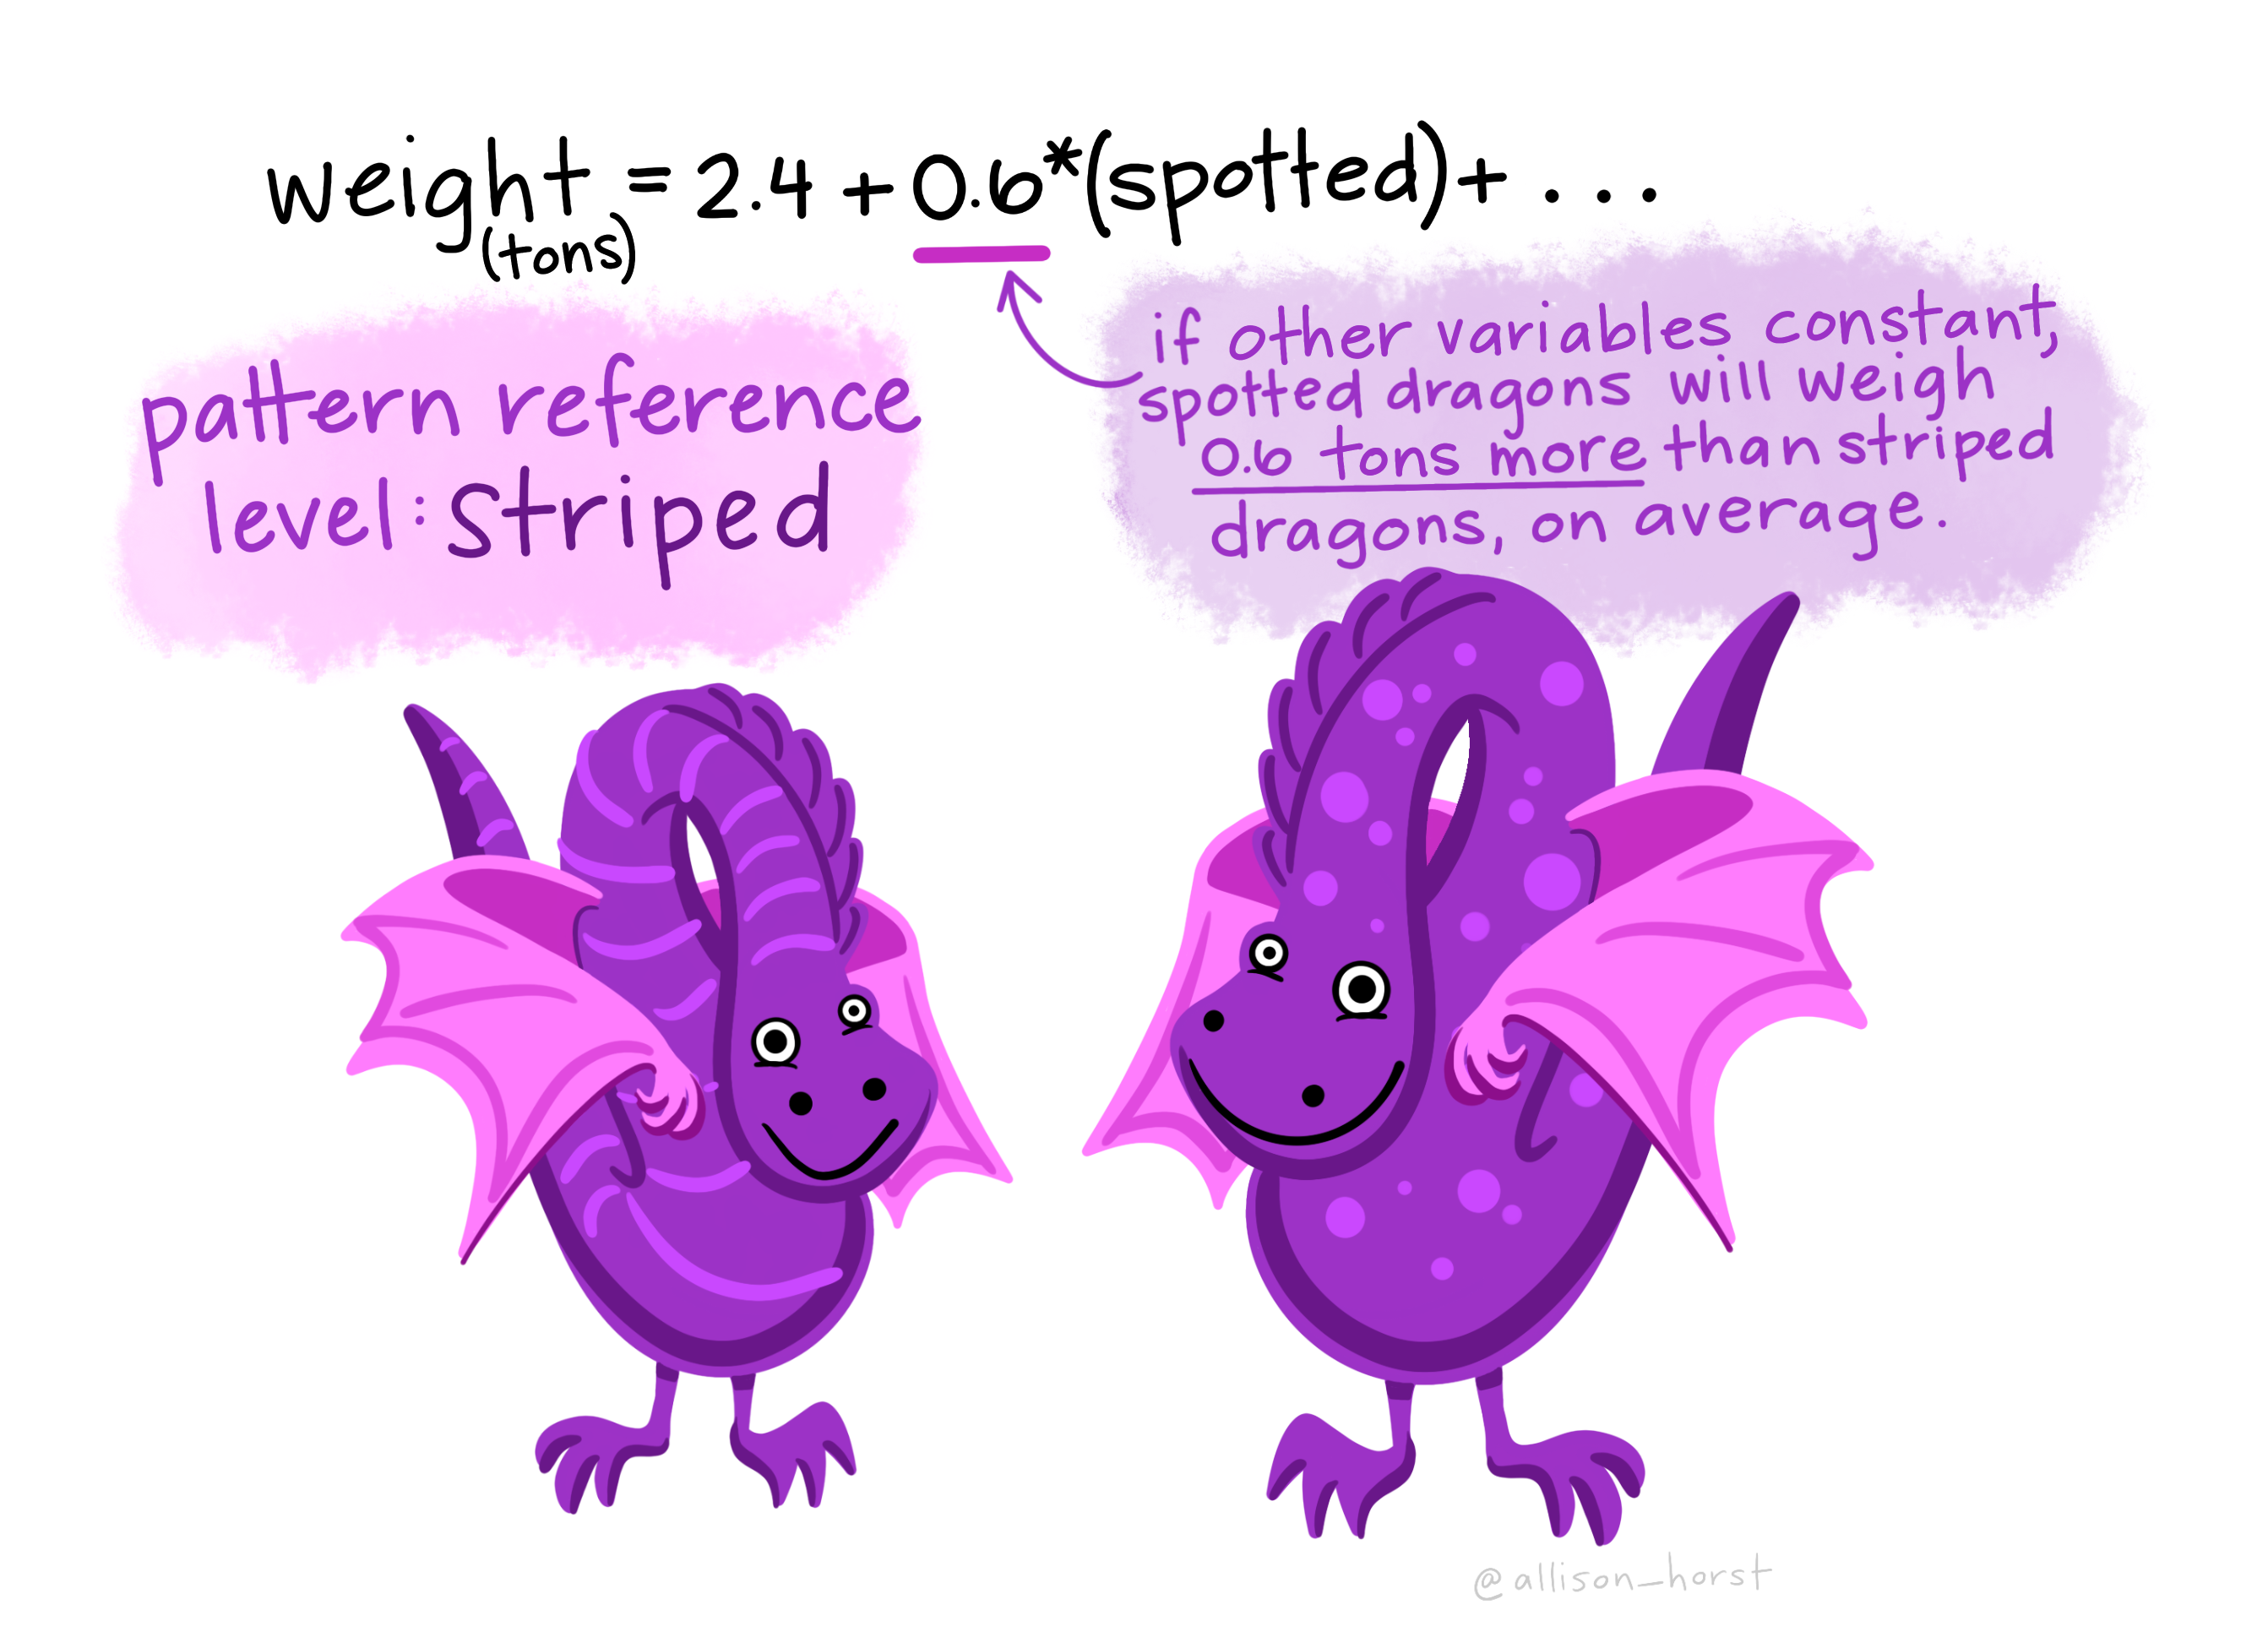
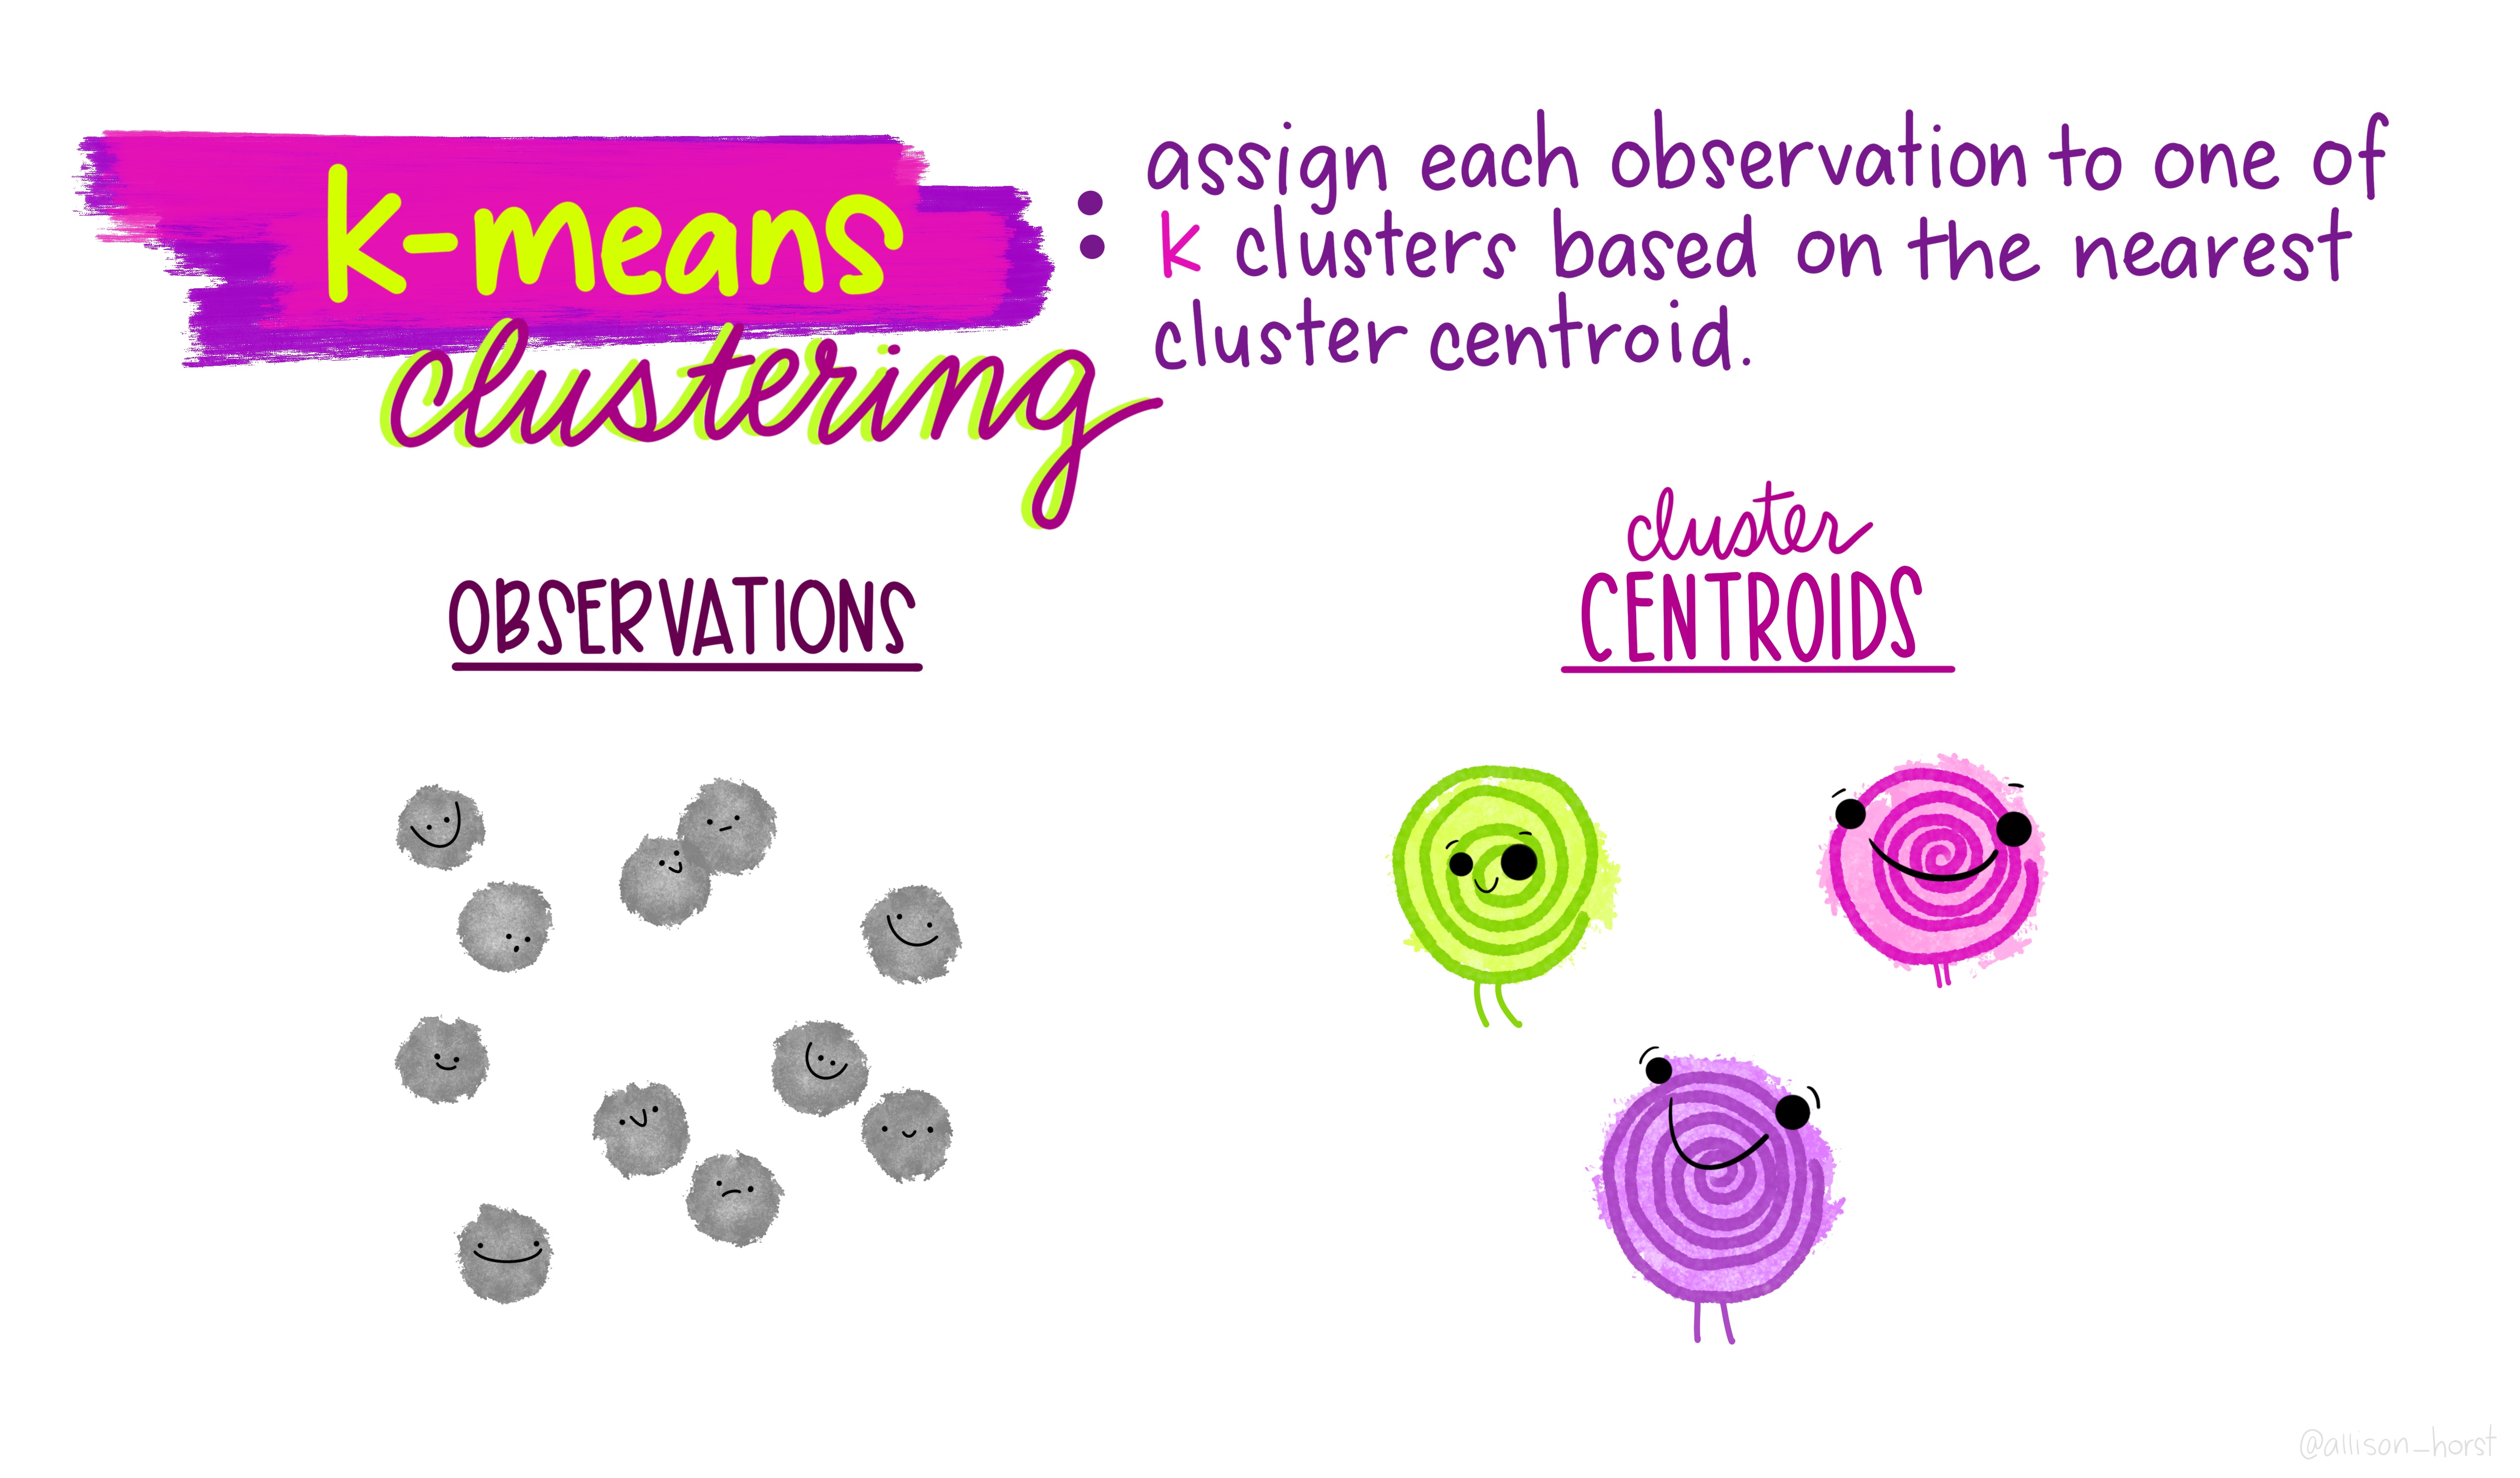
Source: Allison Horst
2. Make it mandatory for the assessment
2. Make it mandatory for the assessment
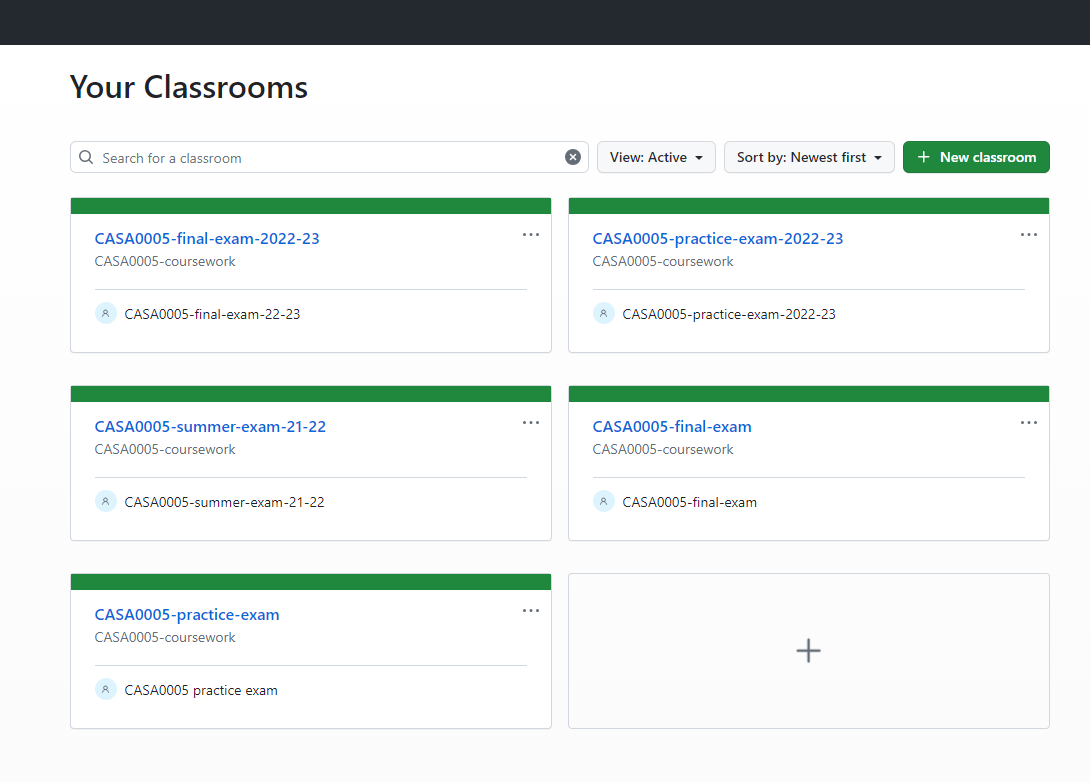
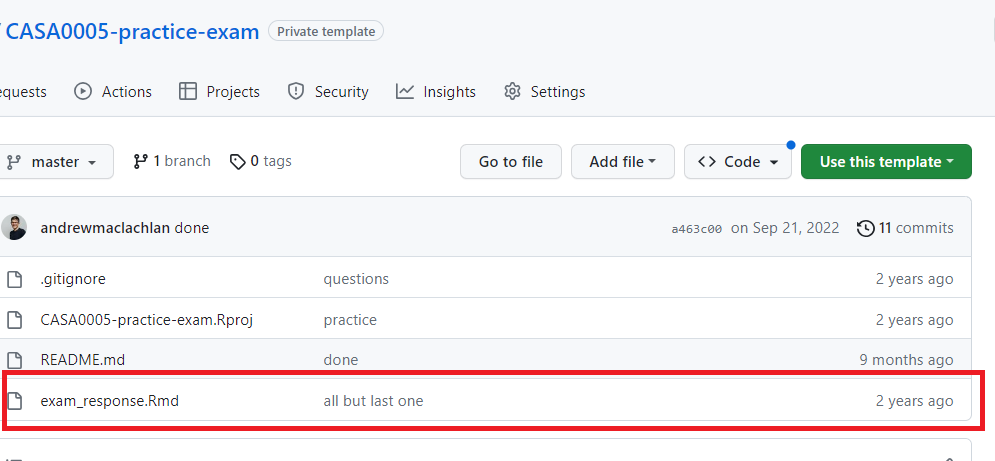
GitHub classroom - setup
Create a template repository “submission”
Import to an “organisation” - shared folder that staff can access
GitHub classroom creates a URL for the template
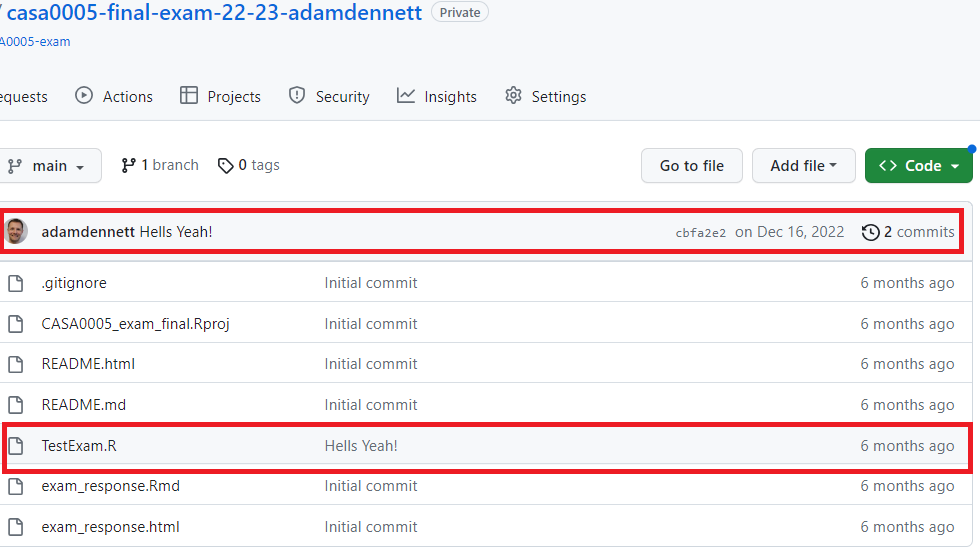
2. Make it mandatory for the assessment
Students
Click the URL and generates a new repository
Staff can see their work and when they make edits (commit / push)
2. Make it mandatory for the assessment
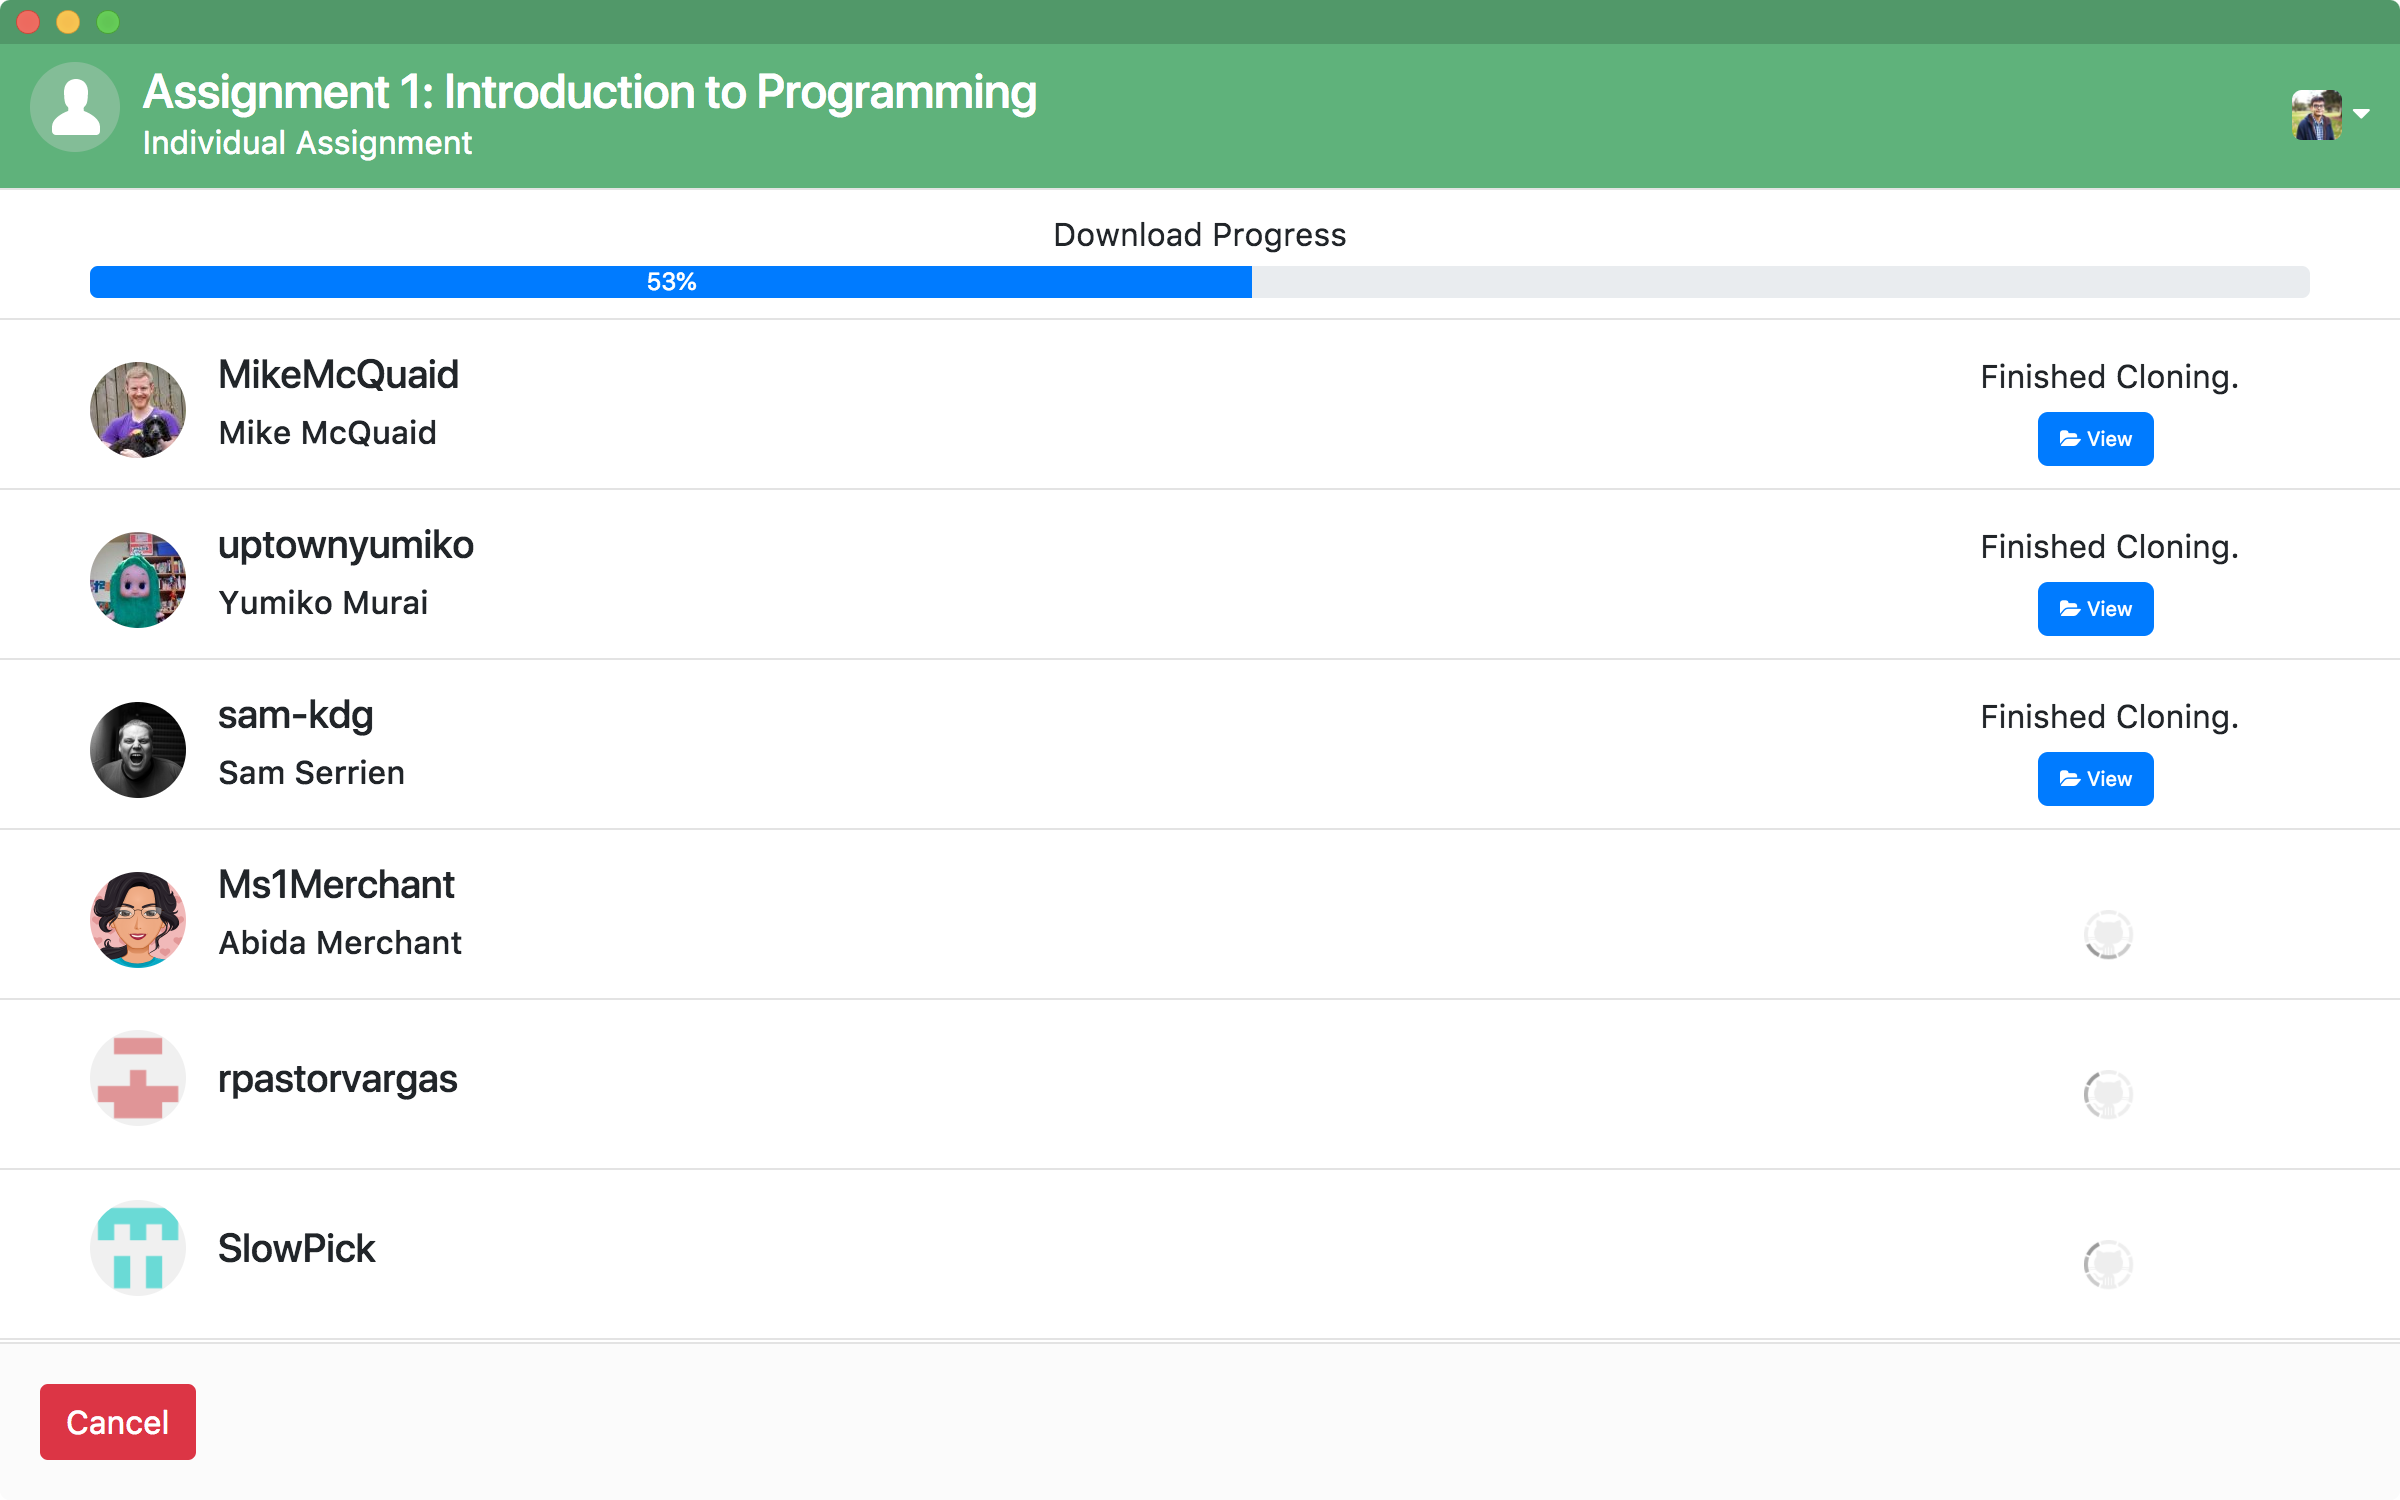
End of exam
Bulk download through the GitHub classroom desktop application
Run the student’s code locally
See how often the student edited the code
Outcomes
Less (almost no) plagiarism
Marks have improved
All students learn to use reproducibility tools
The tool is not directly assessed
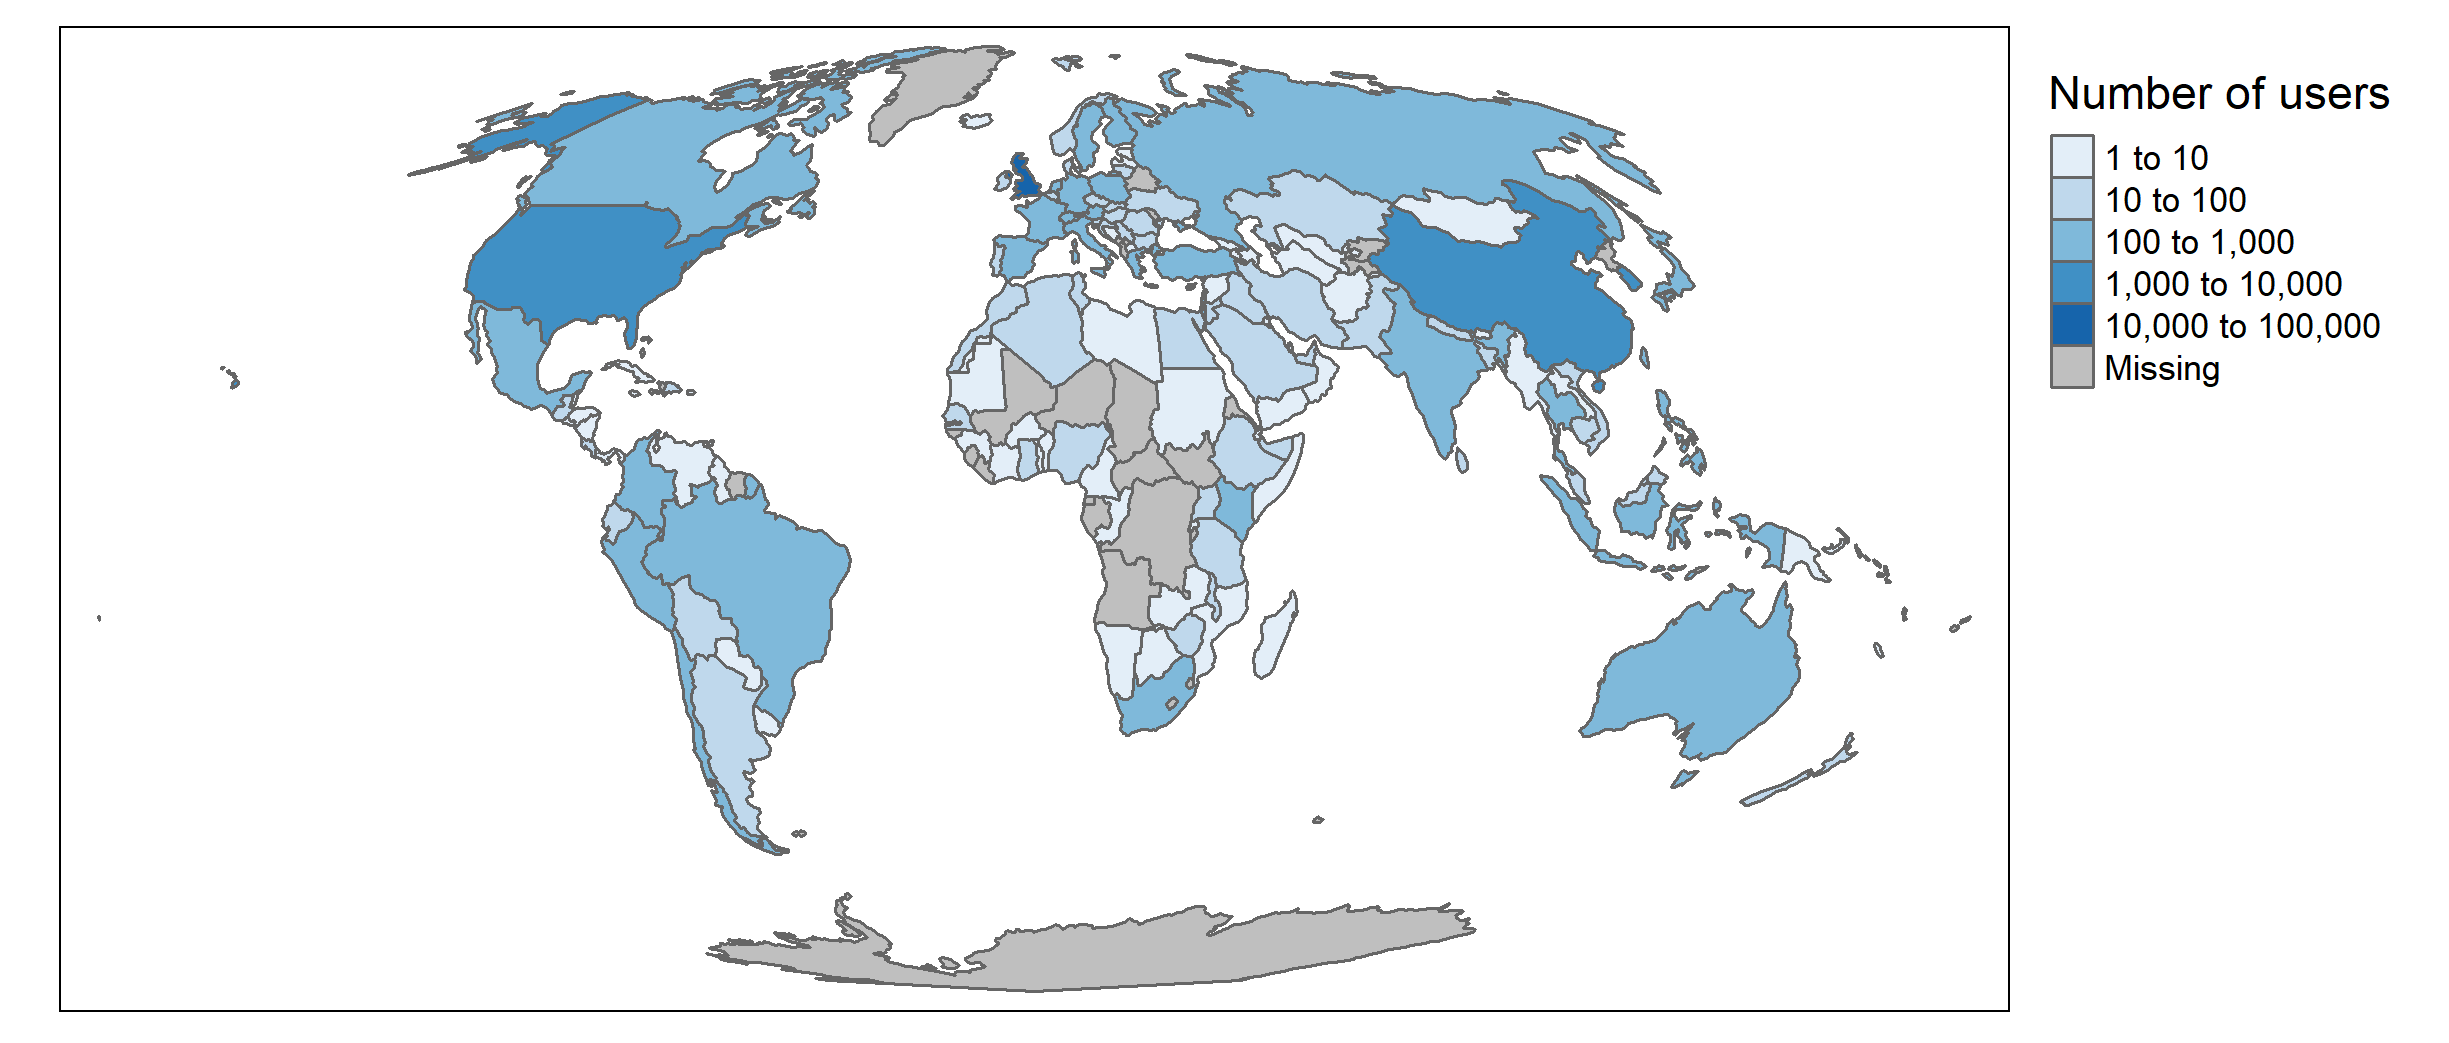
Global use and interaction with the resource

![]()