GIS as a research method
What is spatial data?
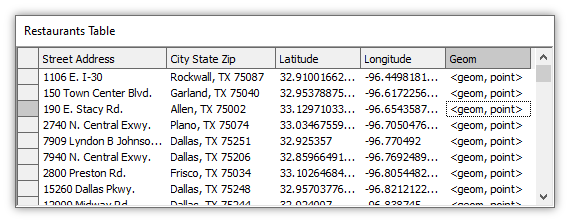
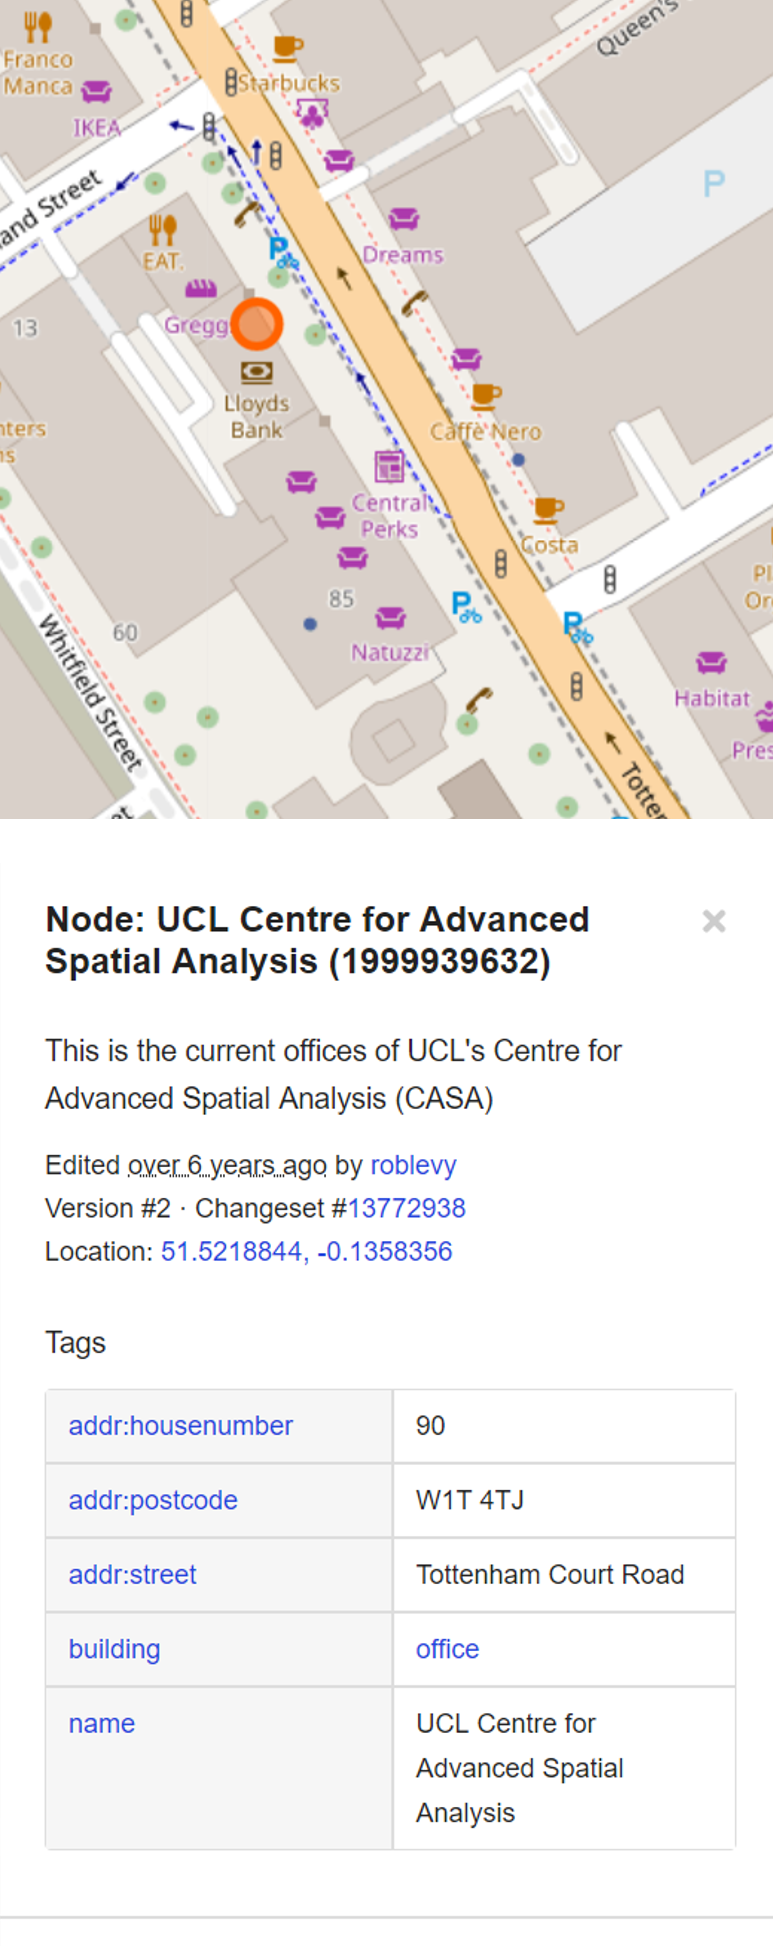
Spatial data is just like normal data except it has an extra “geometry column” often referred to as “geom”
Spatial data
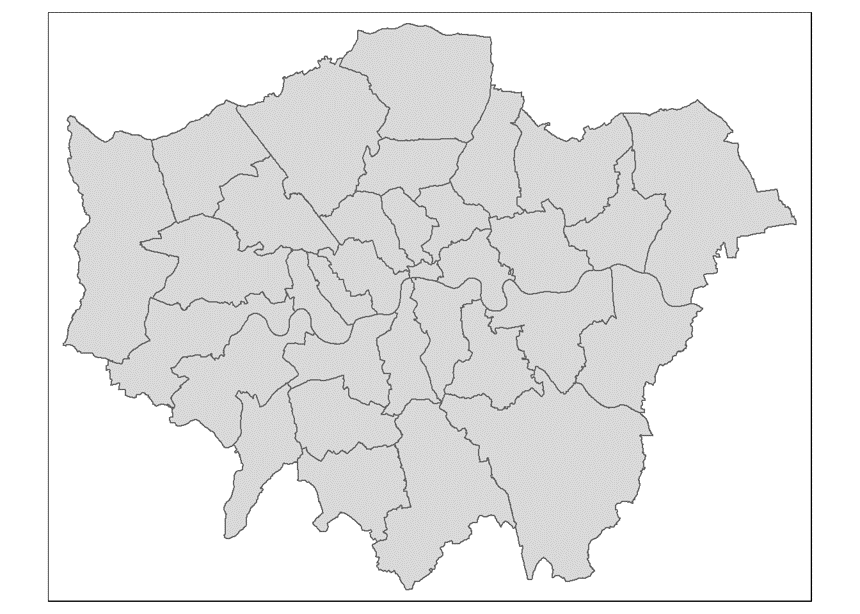
Spatial data is typically an empty shape or object:
- Grid cells / hexagons
- Polygons
- Lines
- Points (e.g. restaurants)
The magic happens when we join non spatial data to spatial data
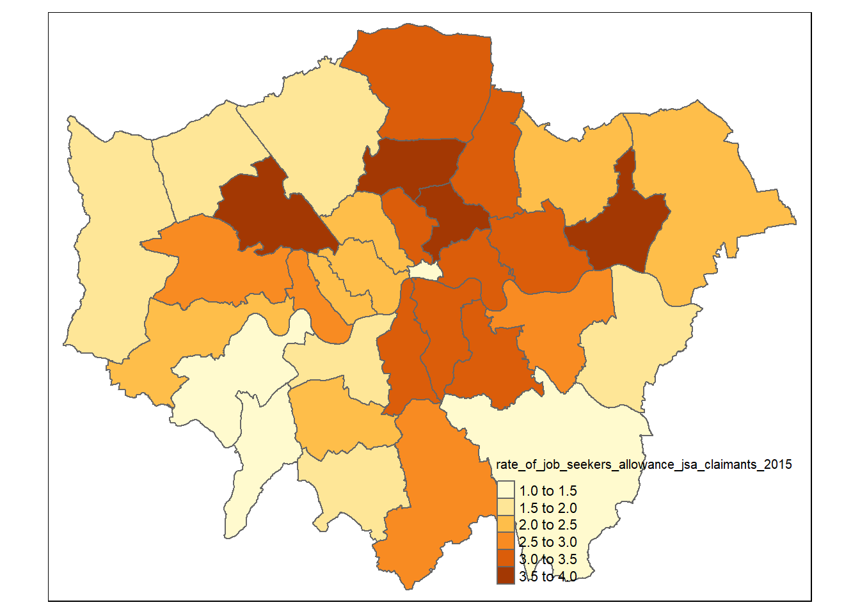
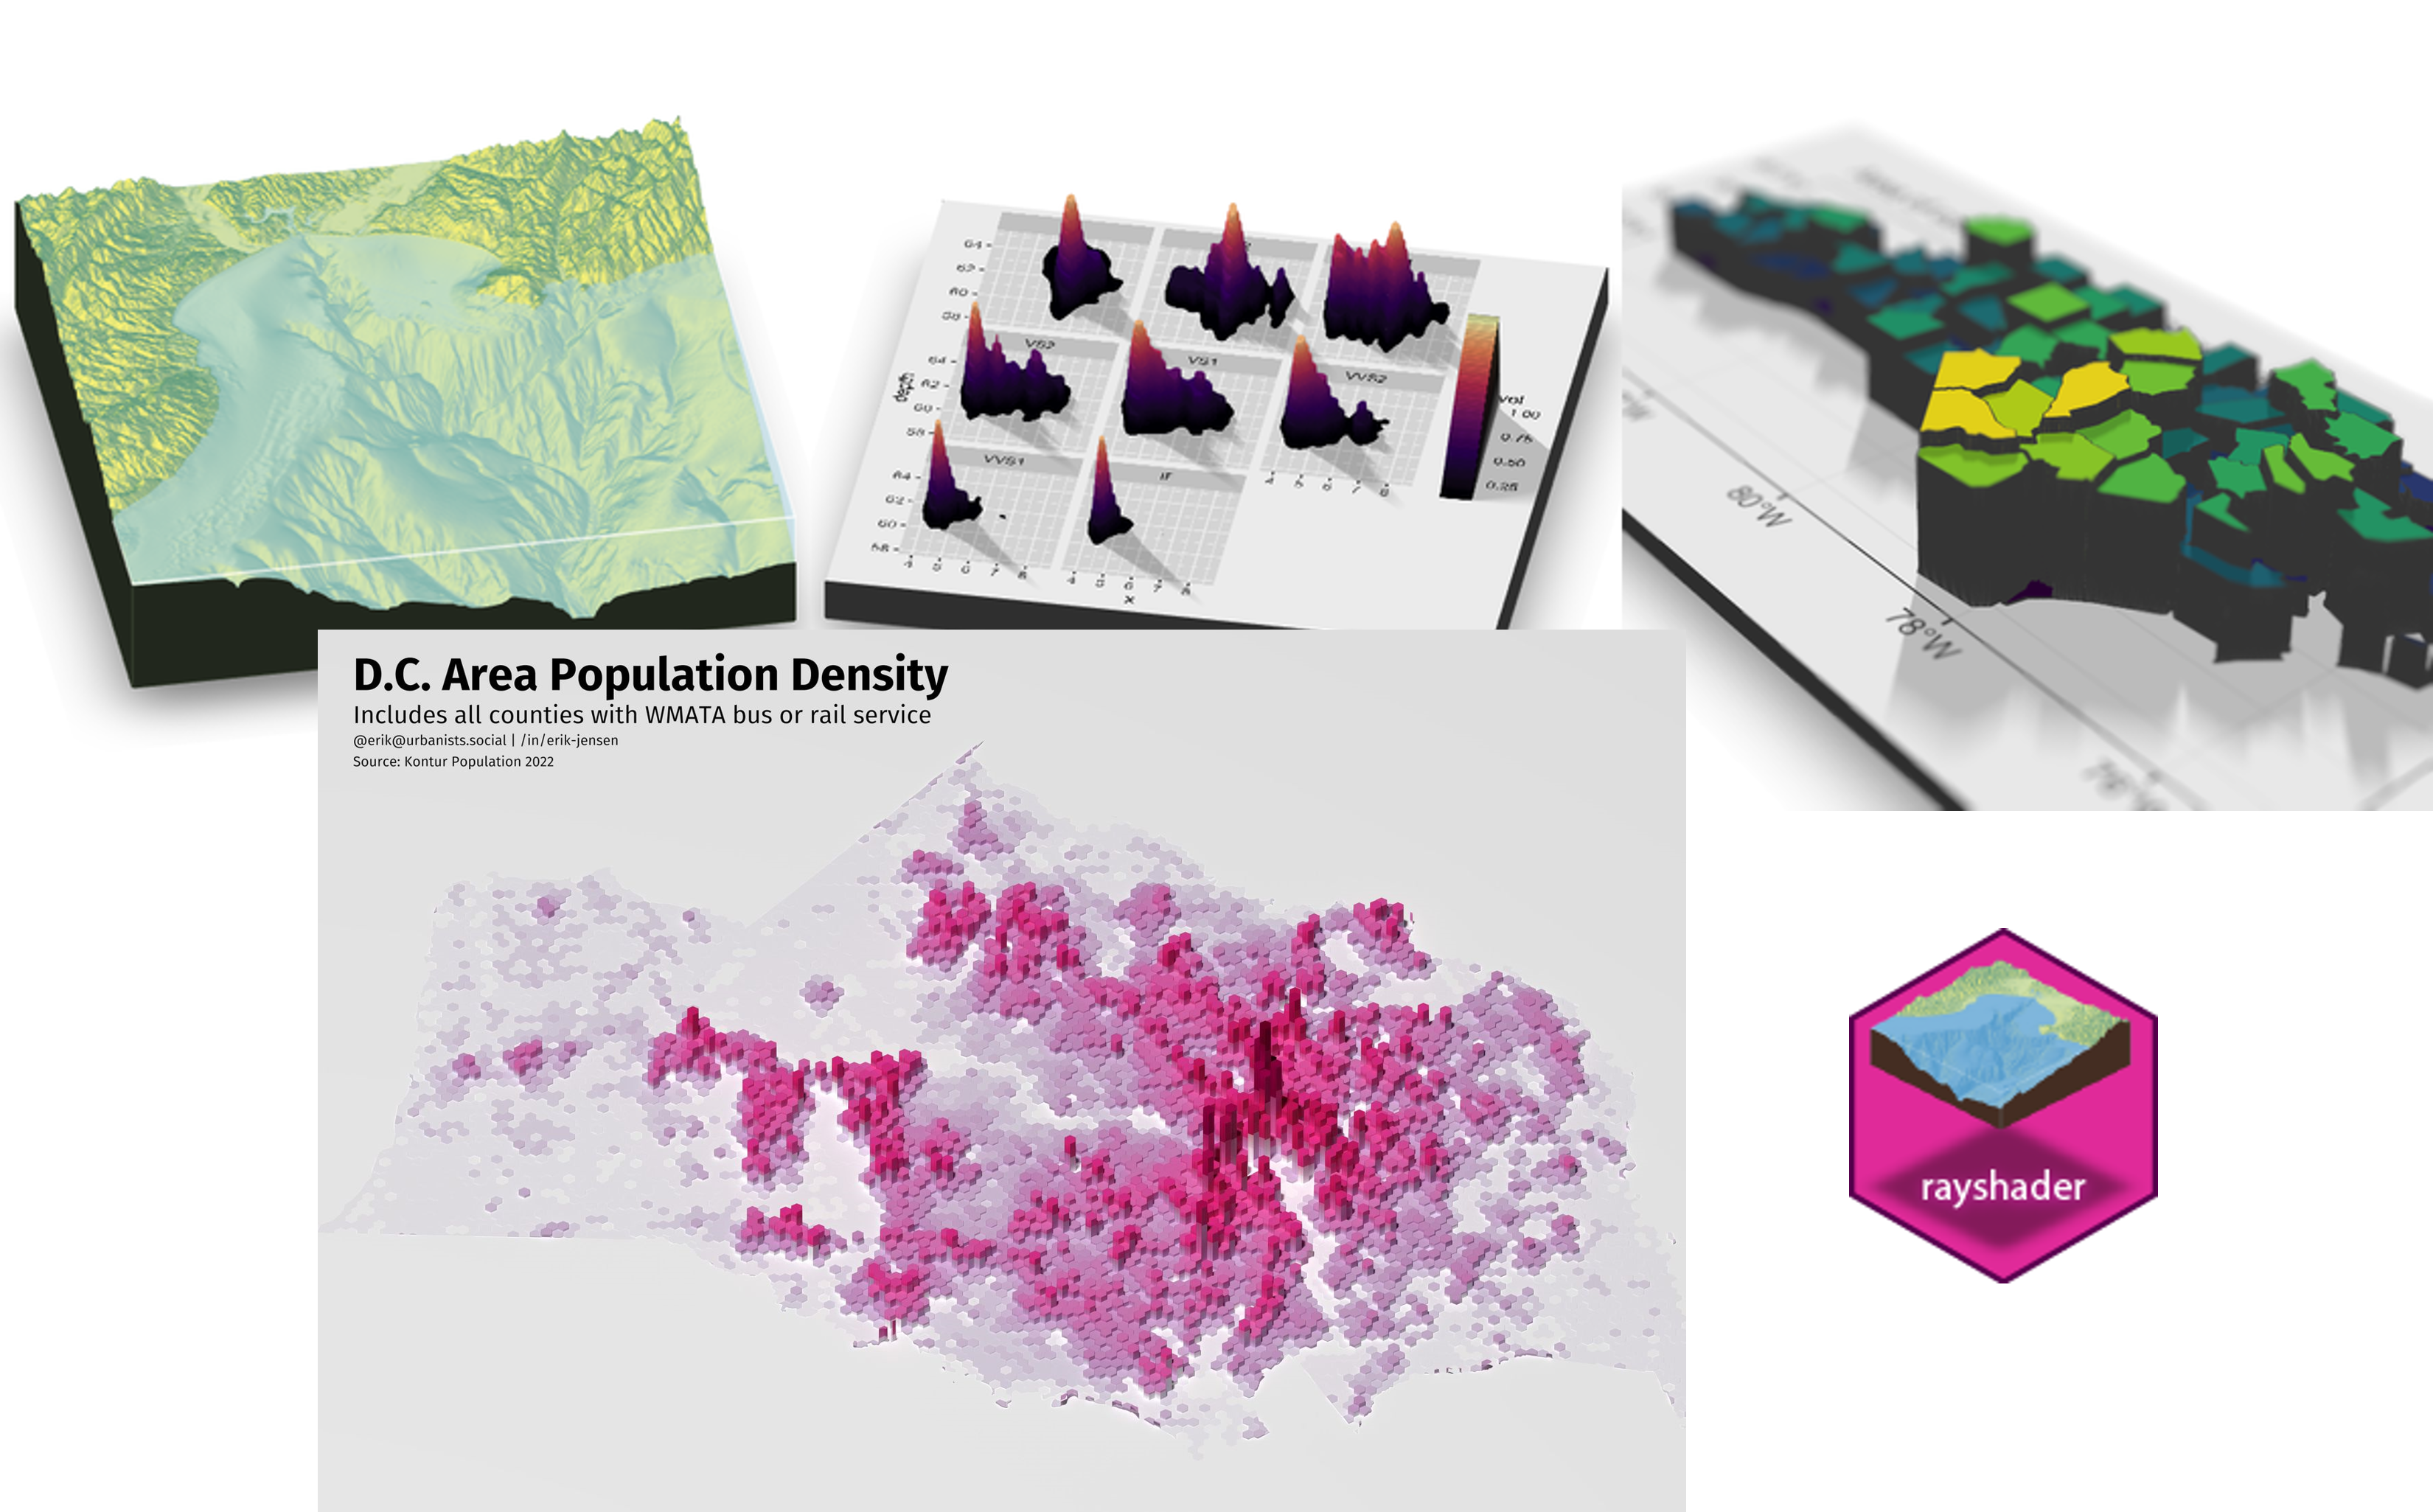
Plot it!
“While we teach our students the benefits of visualization, answering the specific hypothesis-driven questions did not require plotting the data. We found that very often, the students driven by specific hypotheses skipped this simple step towards a broader exploration of the data. In fact, overall, students without a specific hypothesis were almost five times more likely to discover the gorilla when analyzing this dataset”
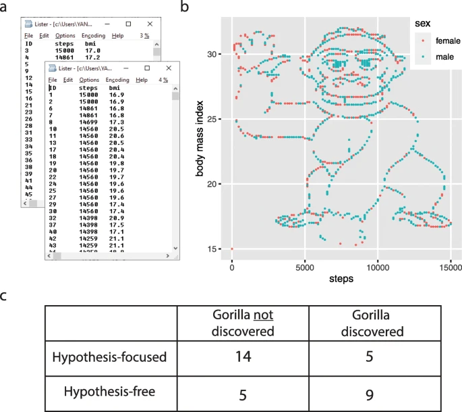 Yanai and Lercher (2020)
Types of spatial data: raster (‘grid’) Vs vector
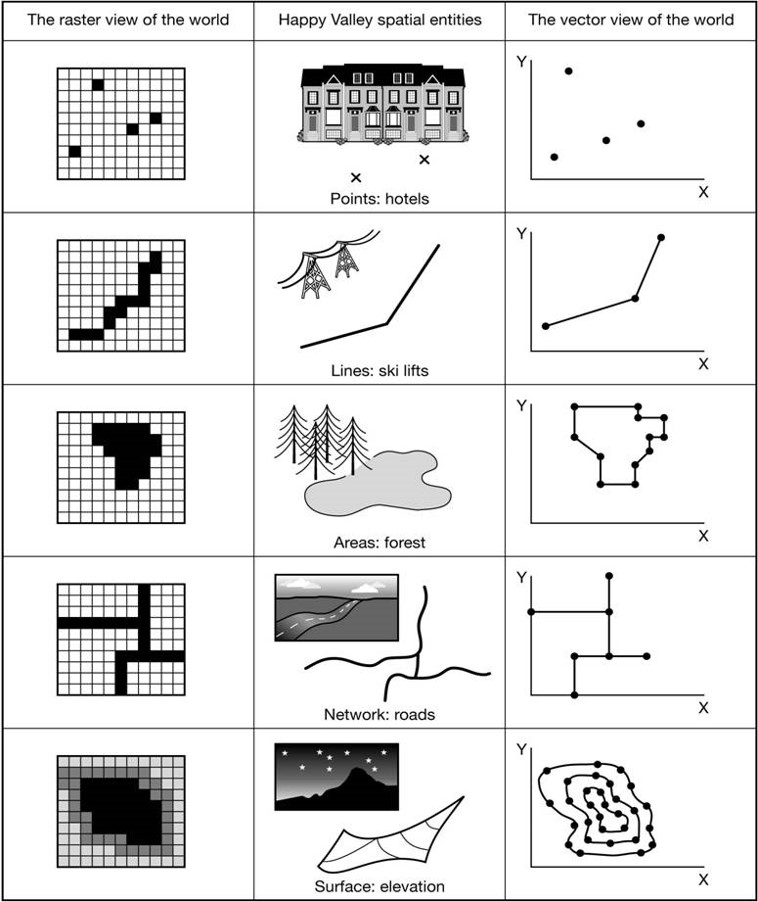
Vector
Raster
Features - vector data
Each column also has a data type
- Text
- Numeric?
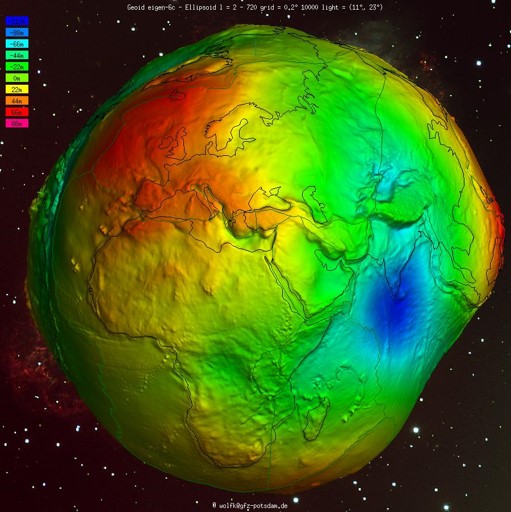
Representing the World
- The earth is a 3D sphere (well, almost). It’s wider than it is tall
- In order to locate a point on the surface of a sphere, we need a set of coordinates
- Coordinates will tell us how near to the top or bottom of the sphere we are, or how far around
- But where do we start?
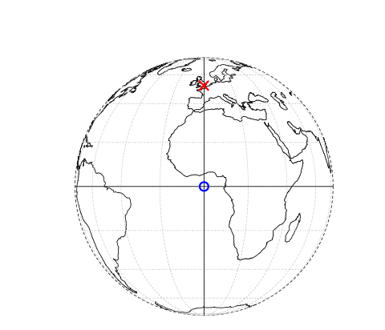
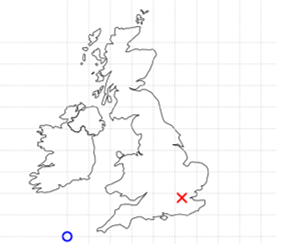
Representing the World
Geographic Coordinate Reference System
- treats the globe as if it was a sphere divided into 360 equal parts called degrees
Projected Coordinate Reference System
- flat, two-dimensional plane (through projecting a spheroid onto a 2D surface) giving it constant lengths, angles and areas
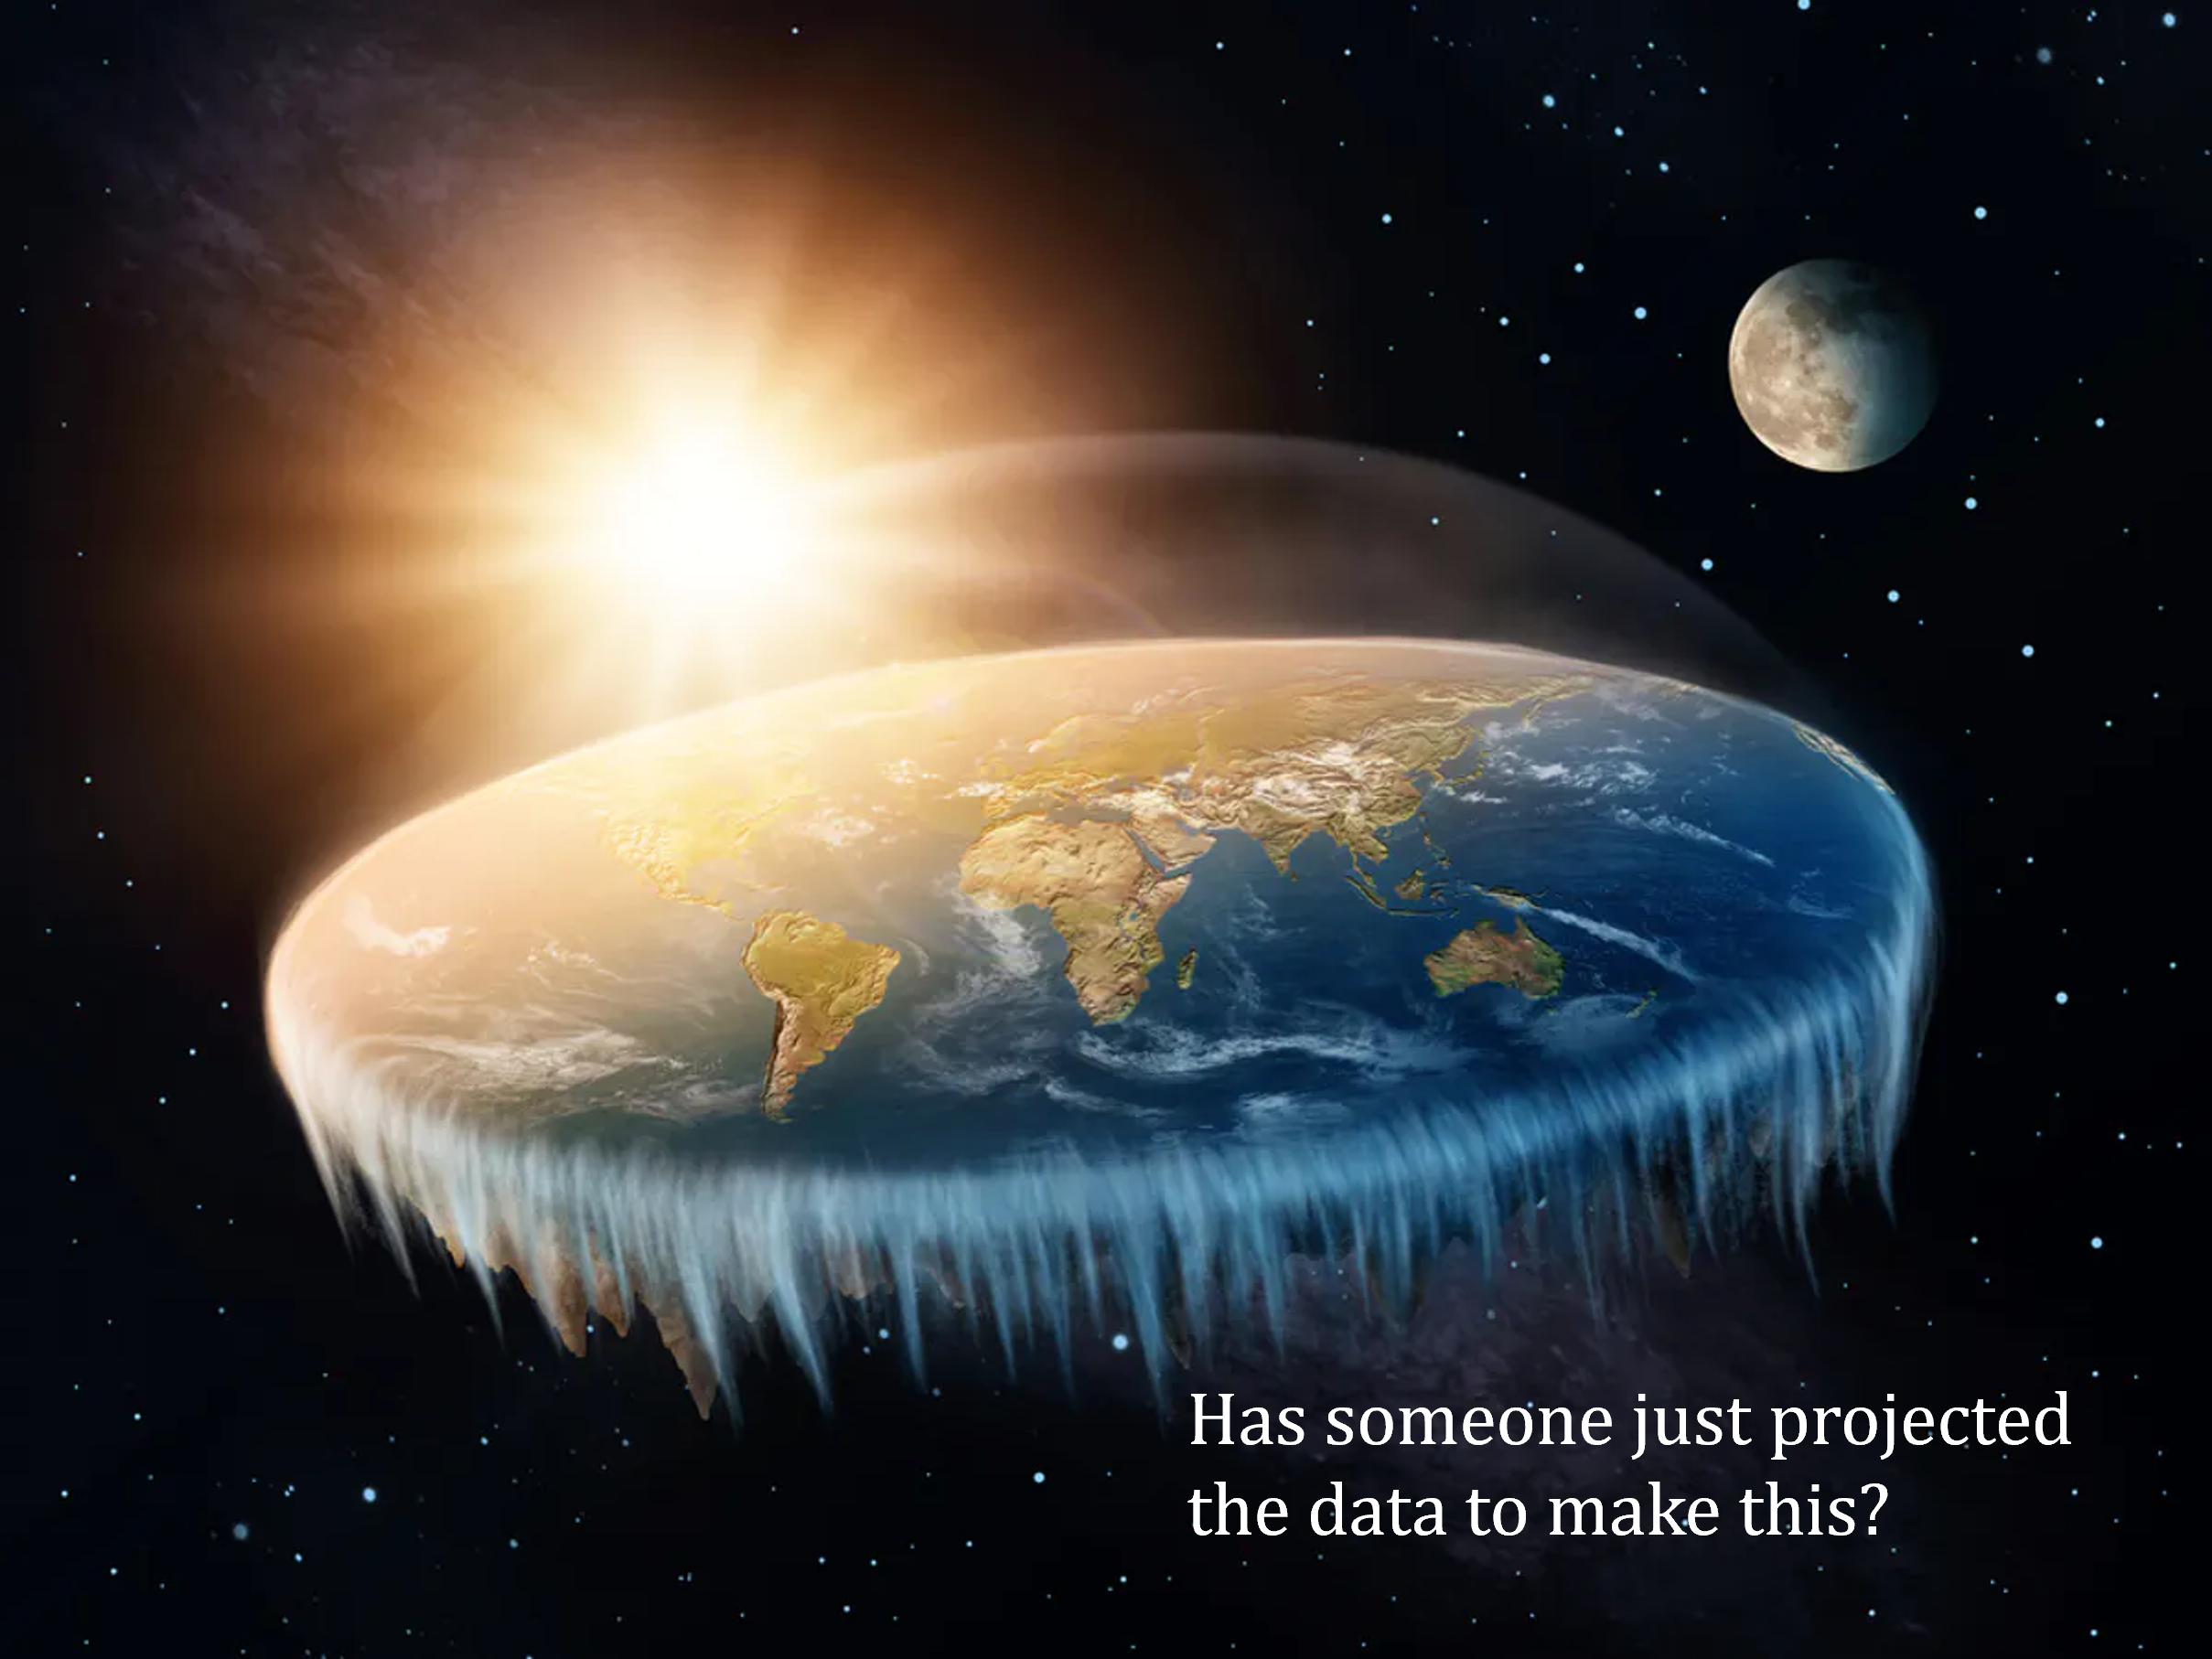
Representing the World
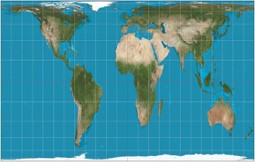
What is wrong with this map?
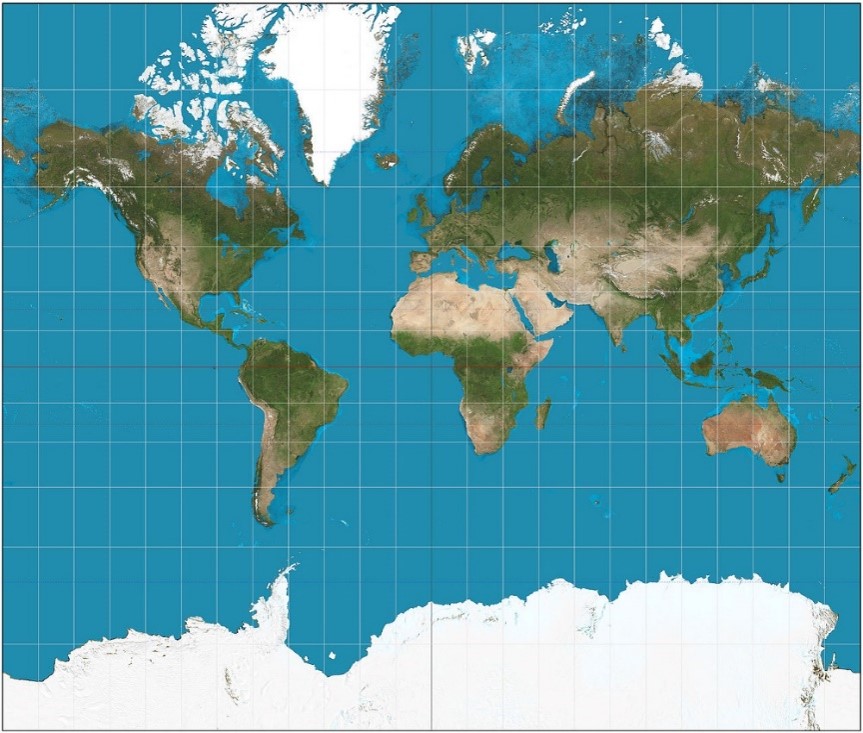
Representing the World
Mercator:
- European imperialist attitude
- Size = POWER, ethnic bias
- Are you a sailor?
Gall-Peters projection:
- Right size of countries
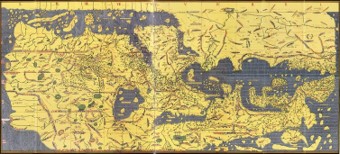
South UP?
- Top = important
- First known map 1154 Arab geographer Muhammad al-Idrisi
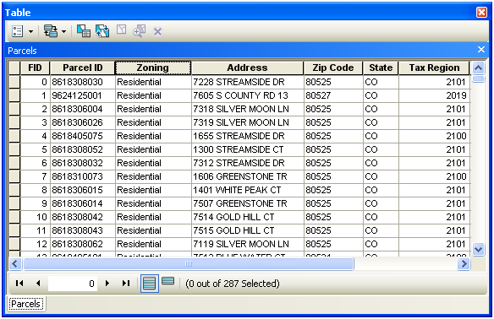
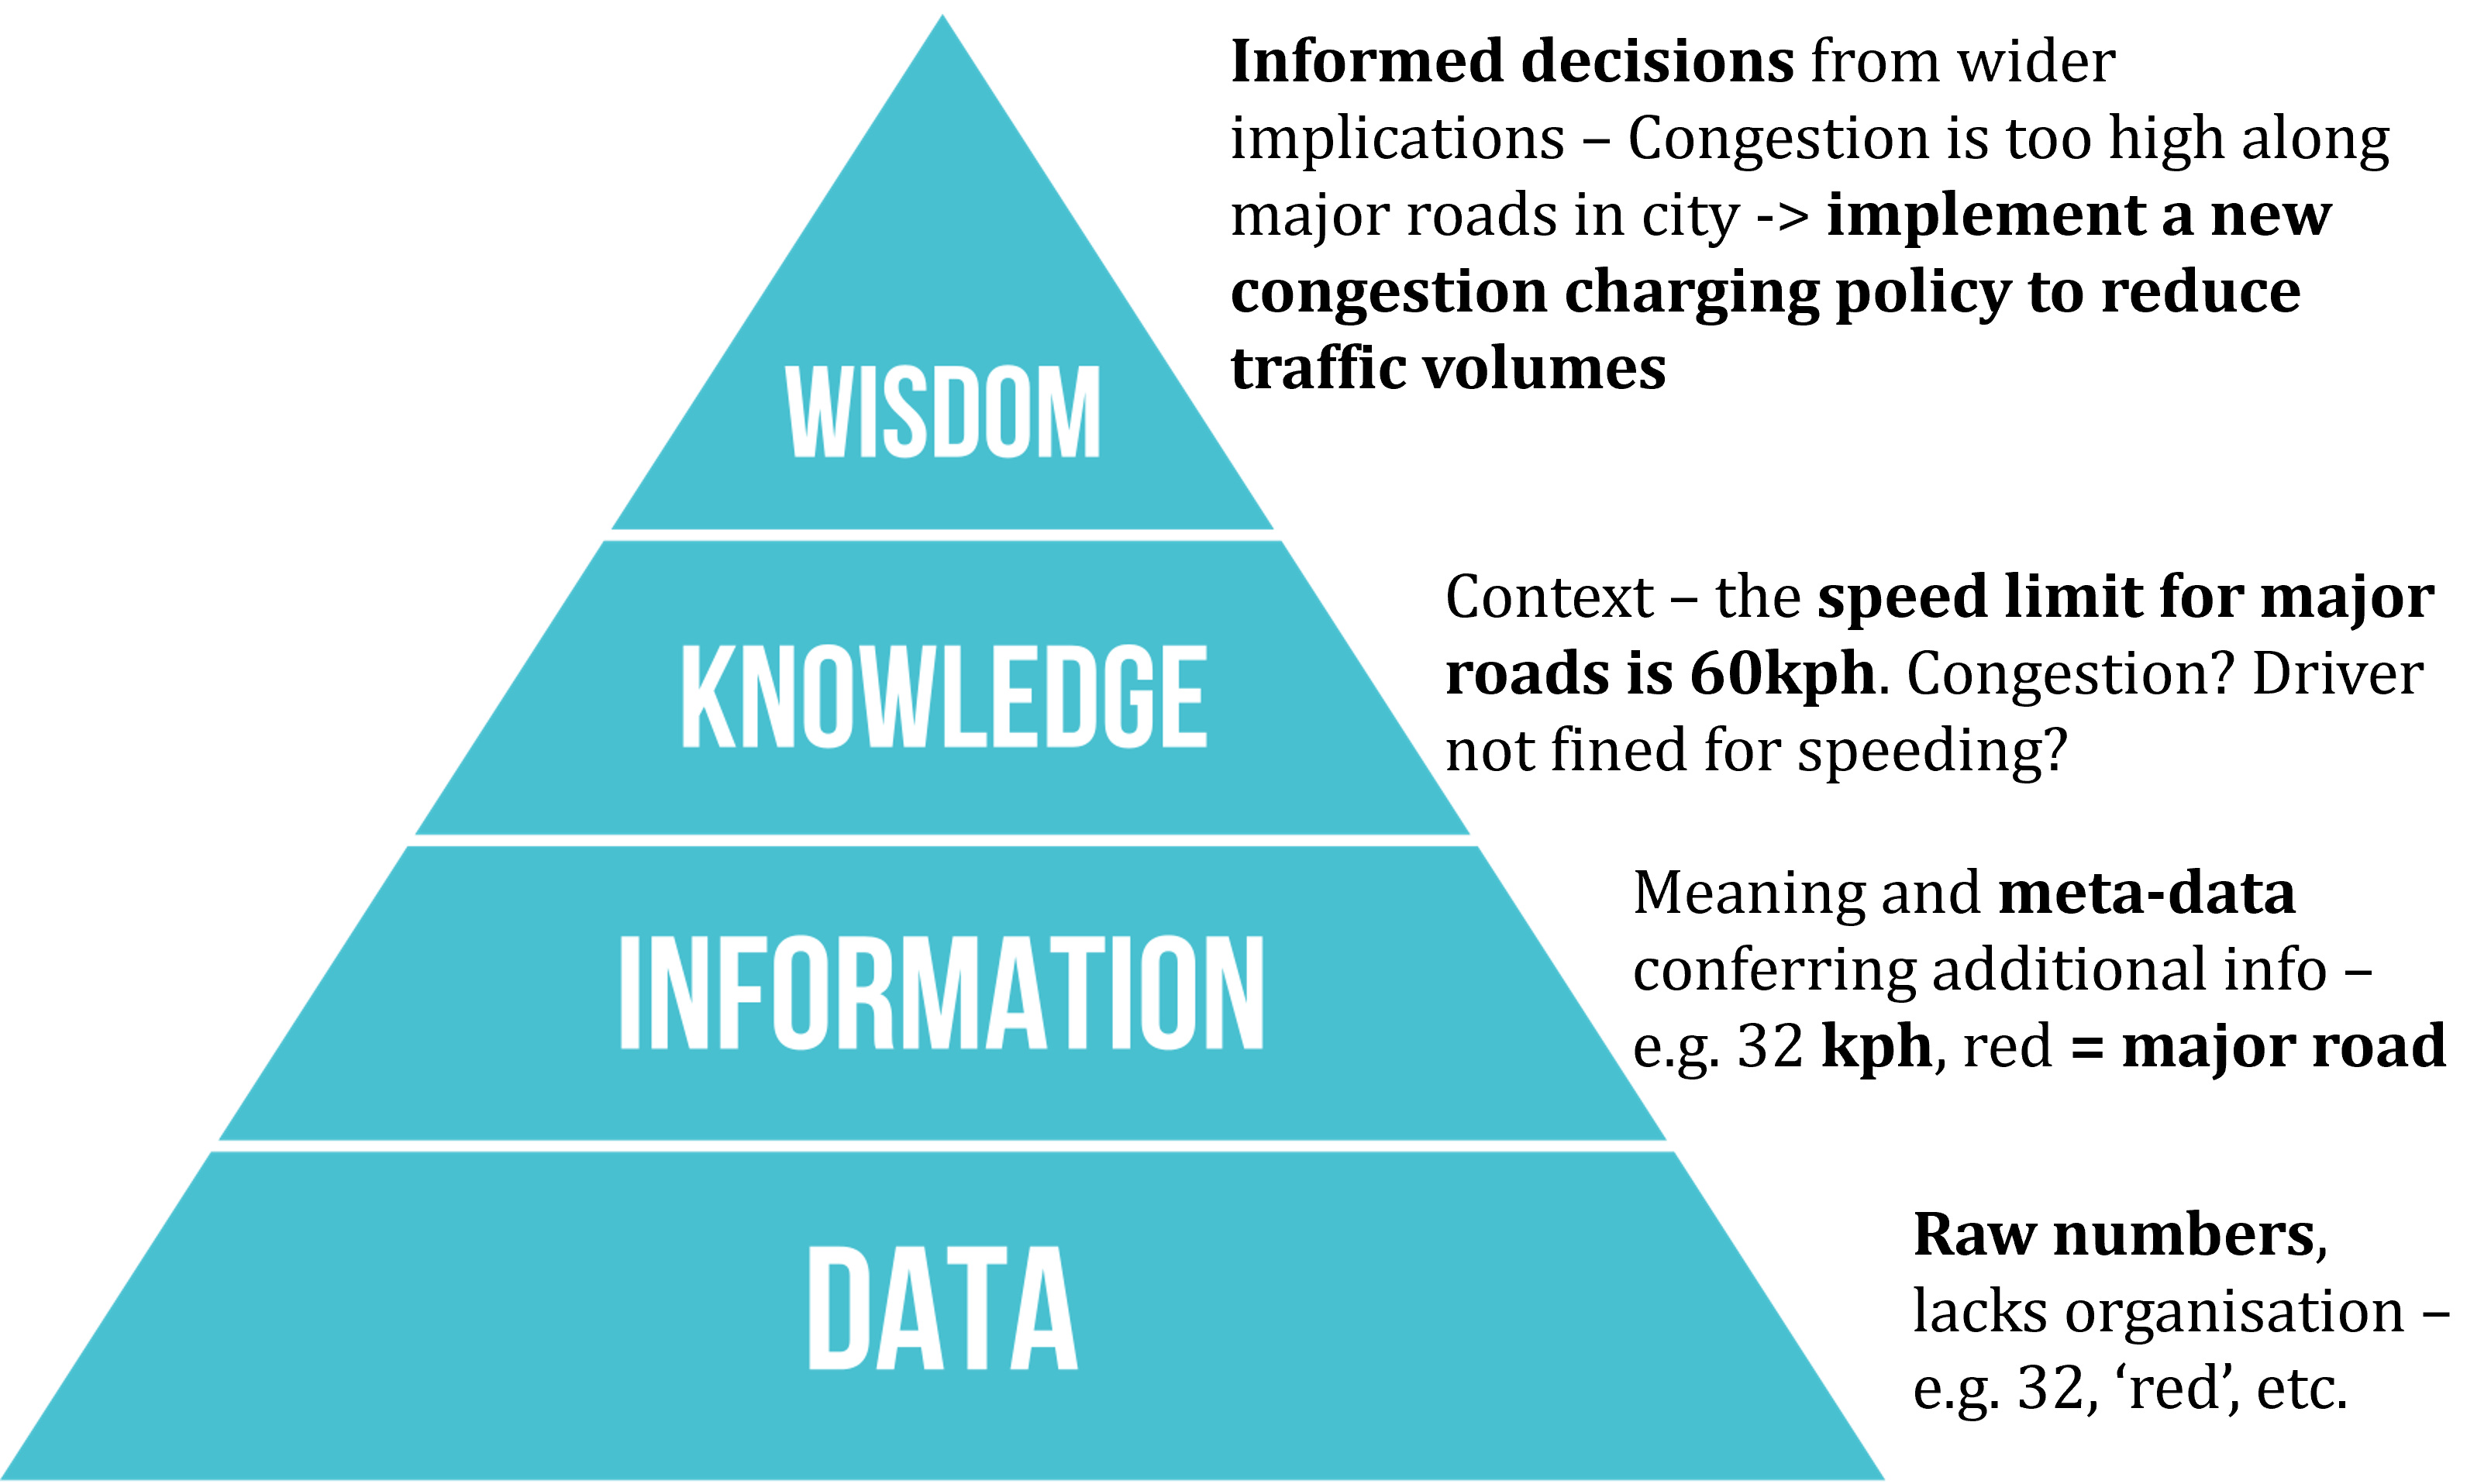
Data vs information
The Canada GIS
Developed by Roger Tomlinson at UCL in 1970s
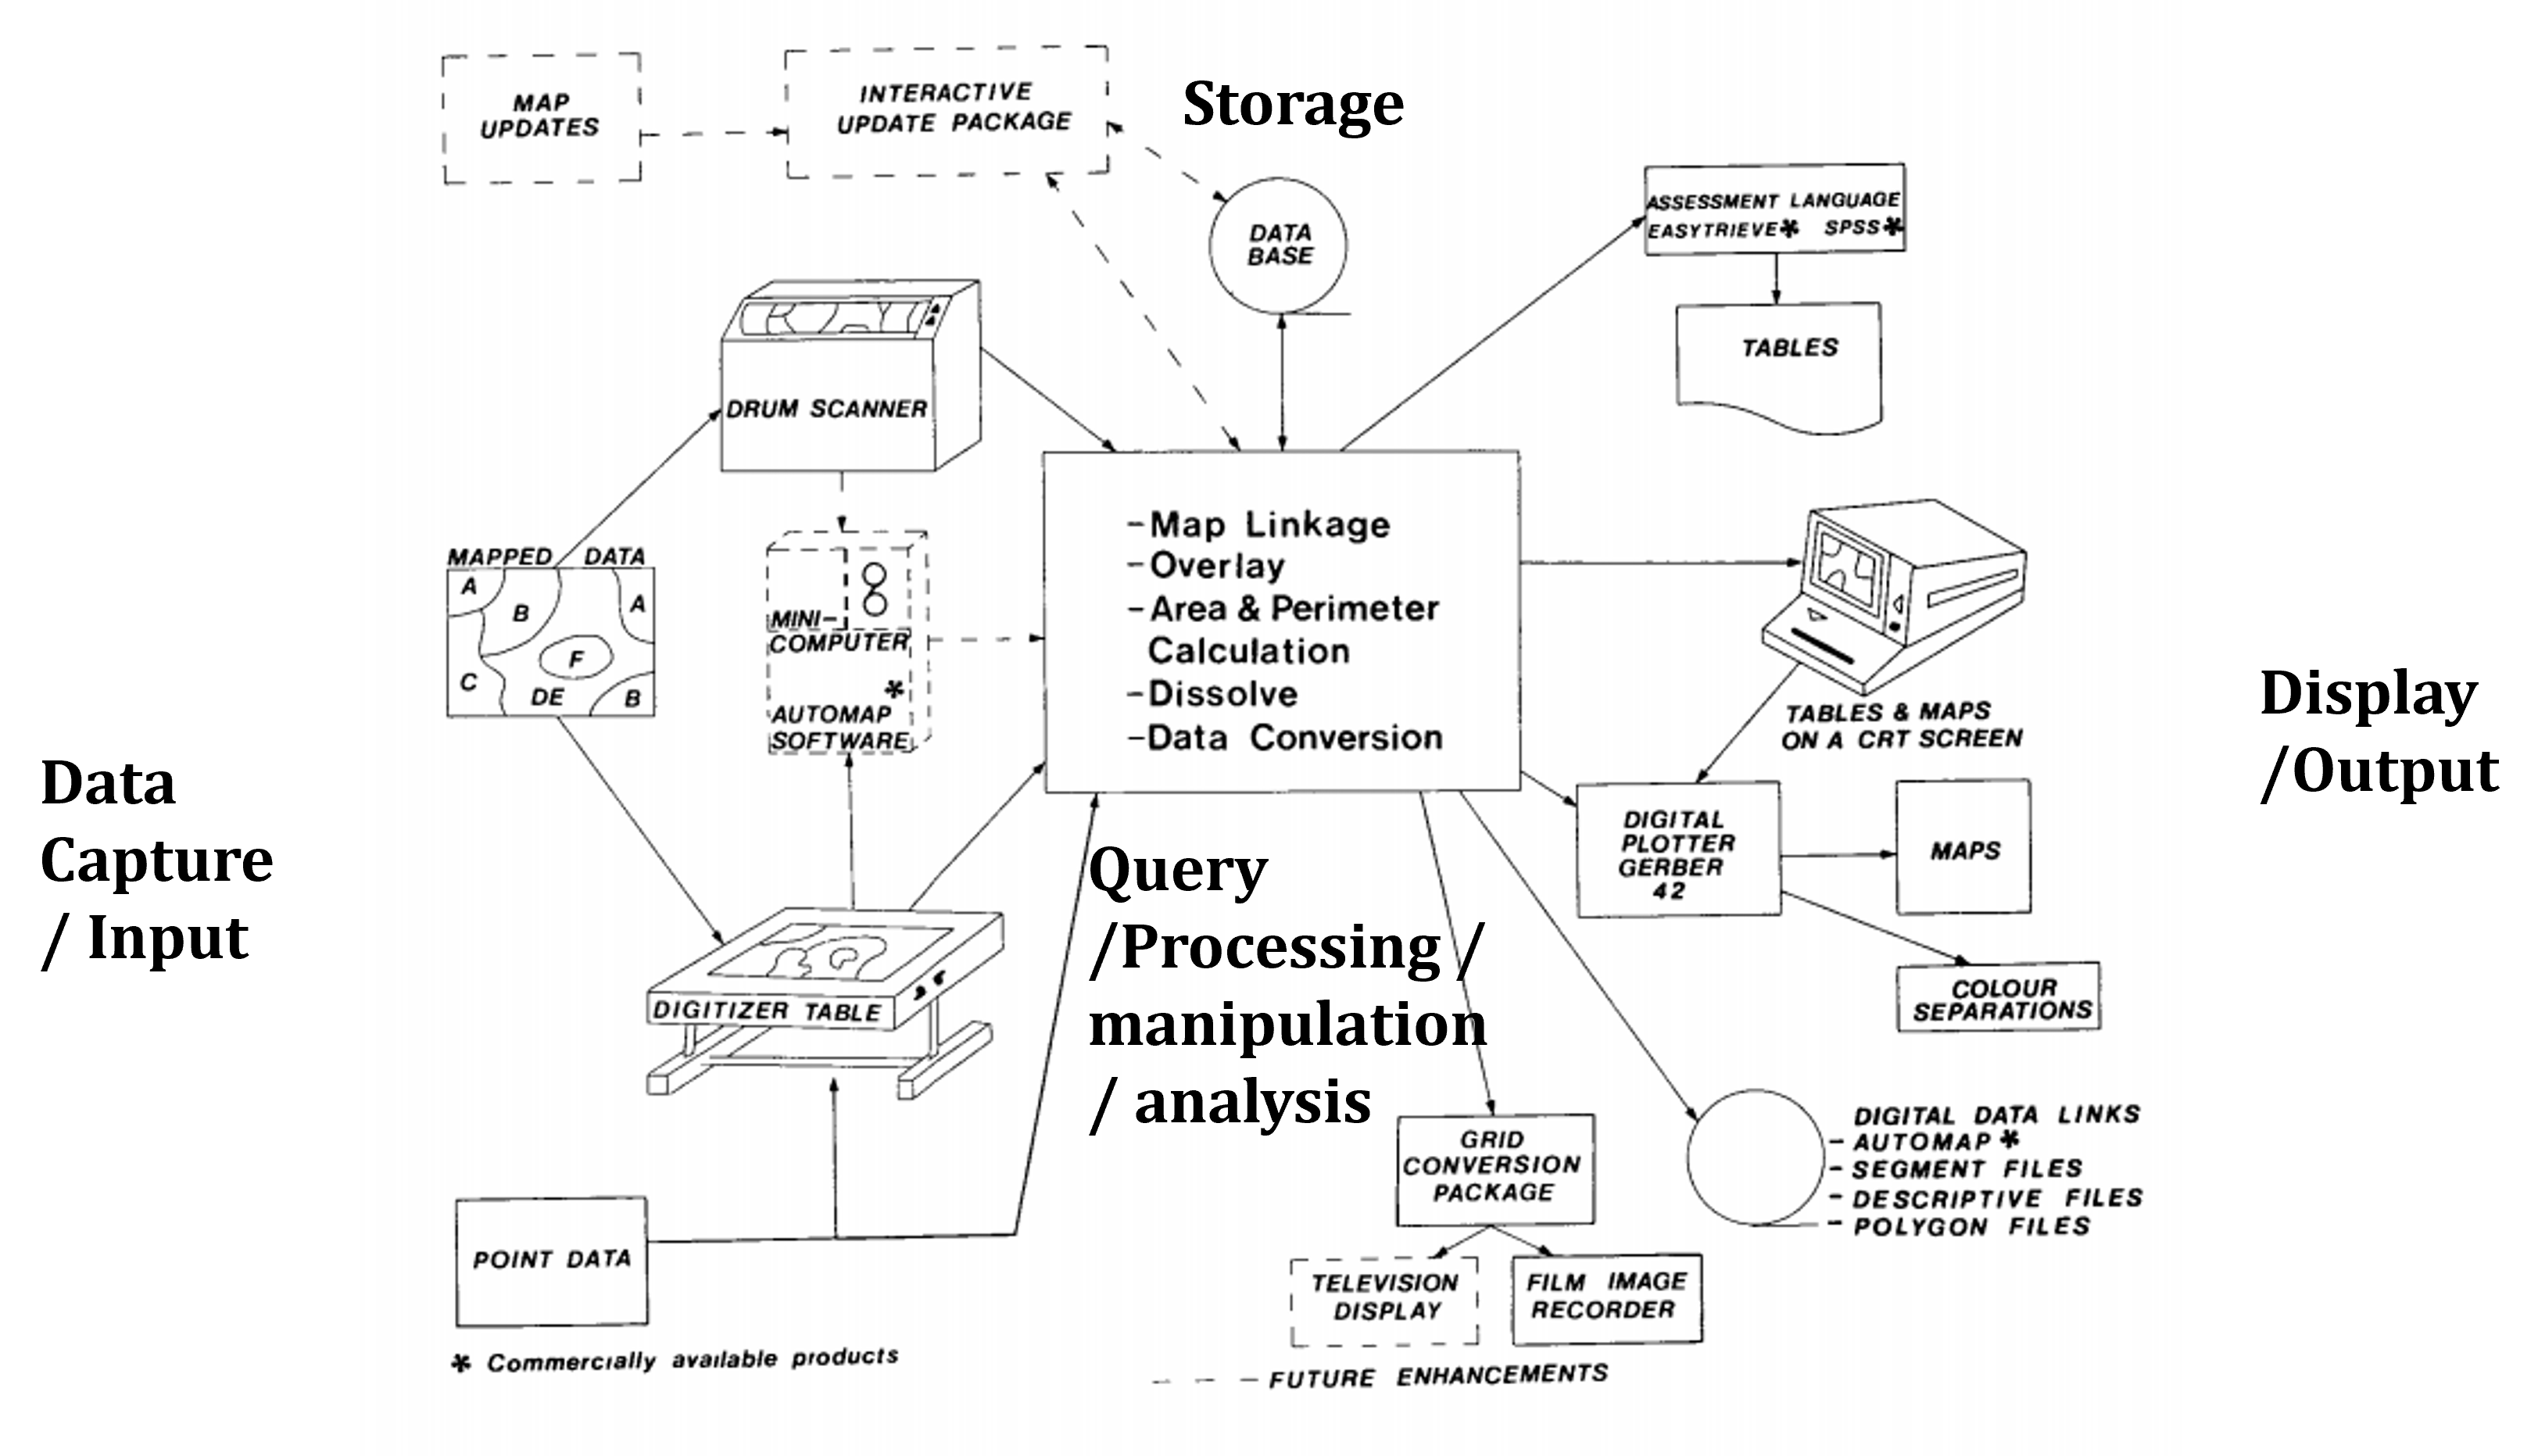
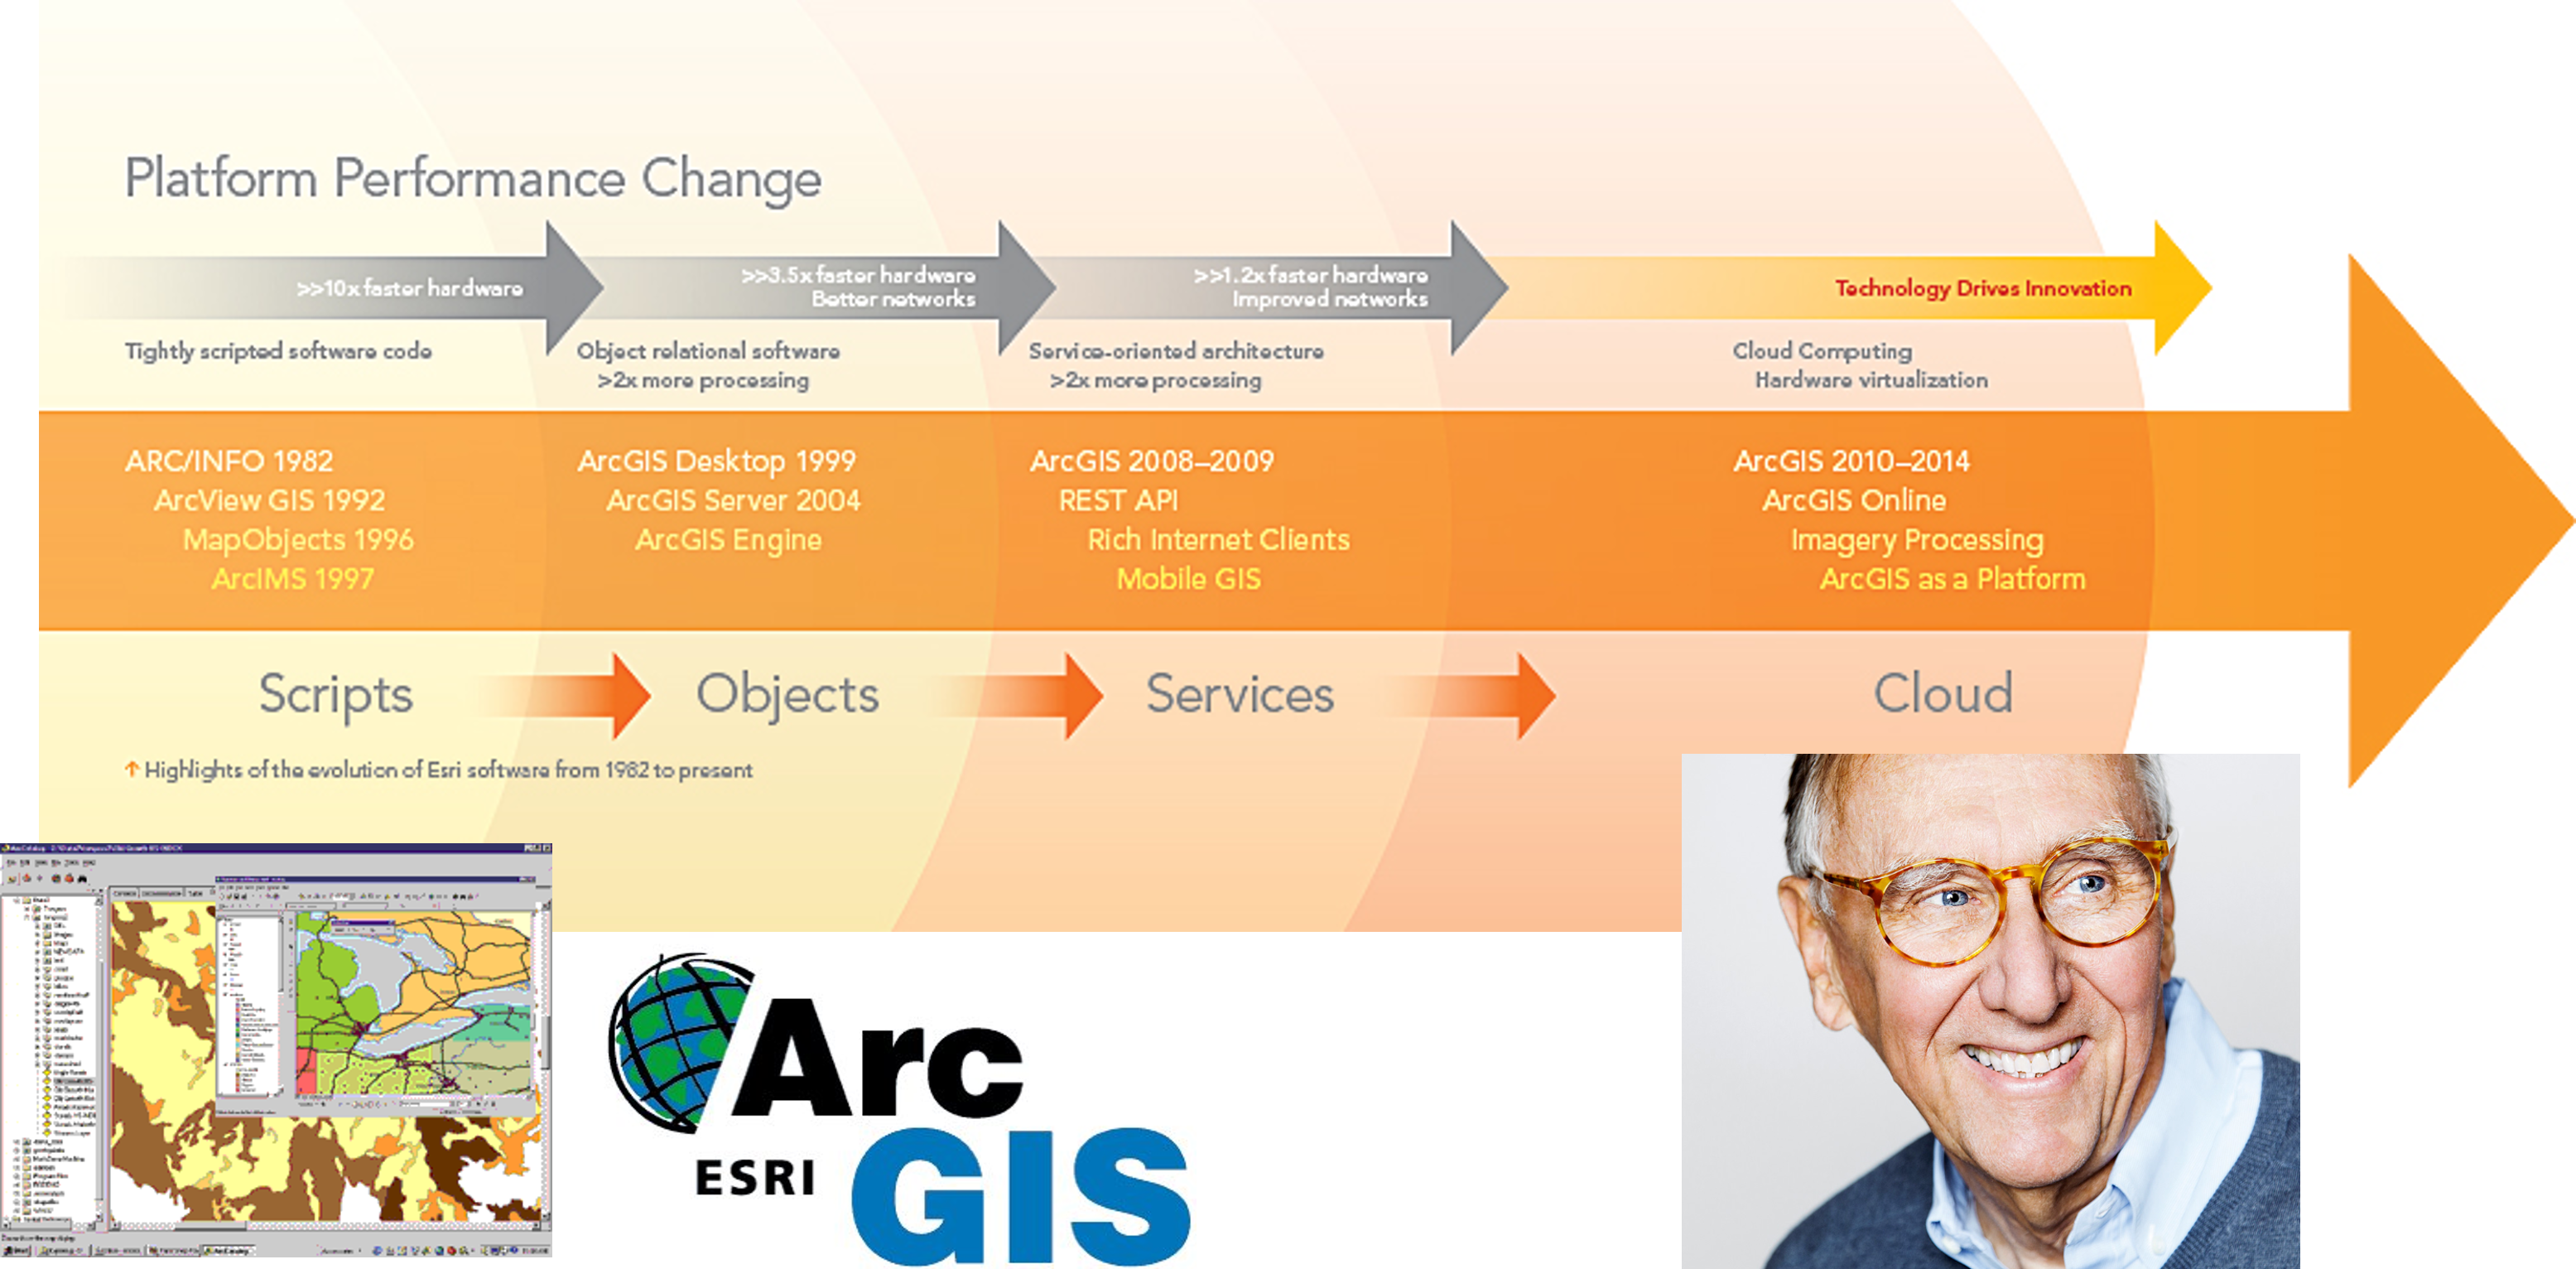
ESRI
From 1982, ESRI cornered the GIS market in terms of data storage, tools for Query /Processing / Manipulation / Analysis and Display / Visualisation
The Graphical User Interface – GUI – allowed non-specialists to carry out GI Science for the first time
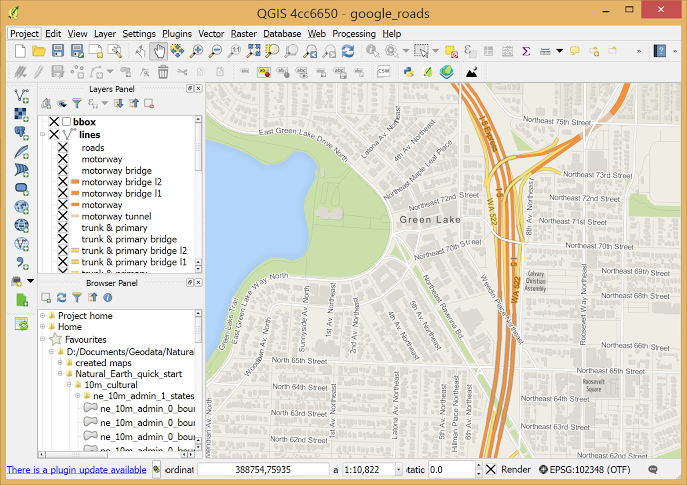
QGIS (Quantum GIS)
- Under development since 2002
- Free & Open Source – everything is on github!
- Probably best GUI GIS aside from Arc
- Connects to PostGIS database very effectively
- Slick maps with nice default features
- Large library of plugins for analysis
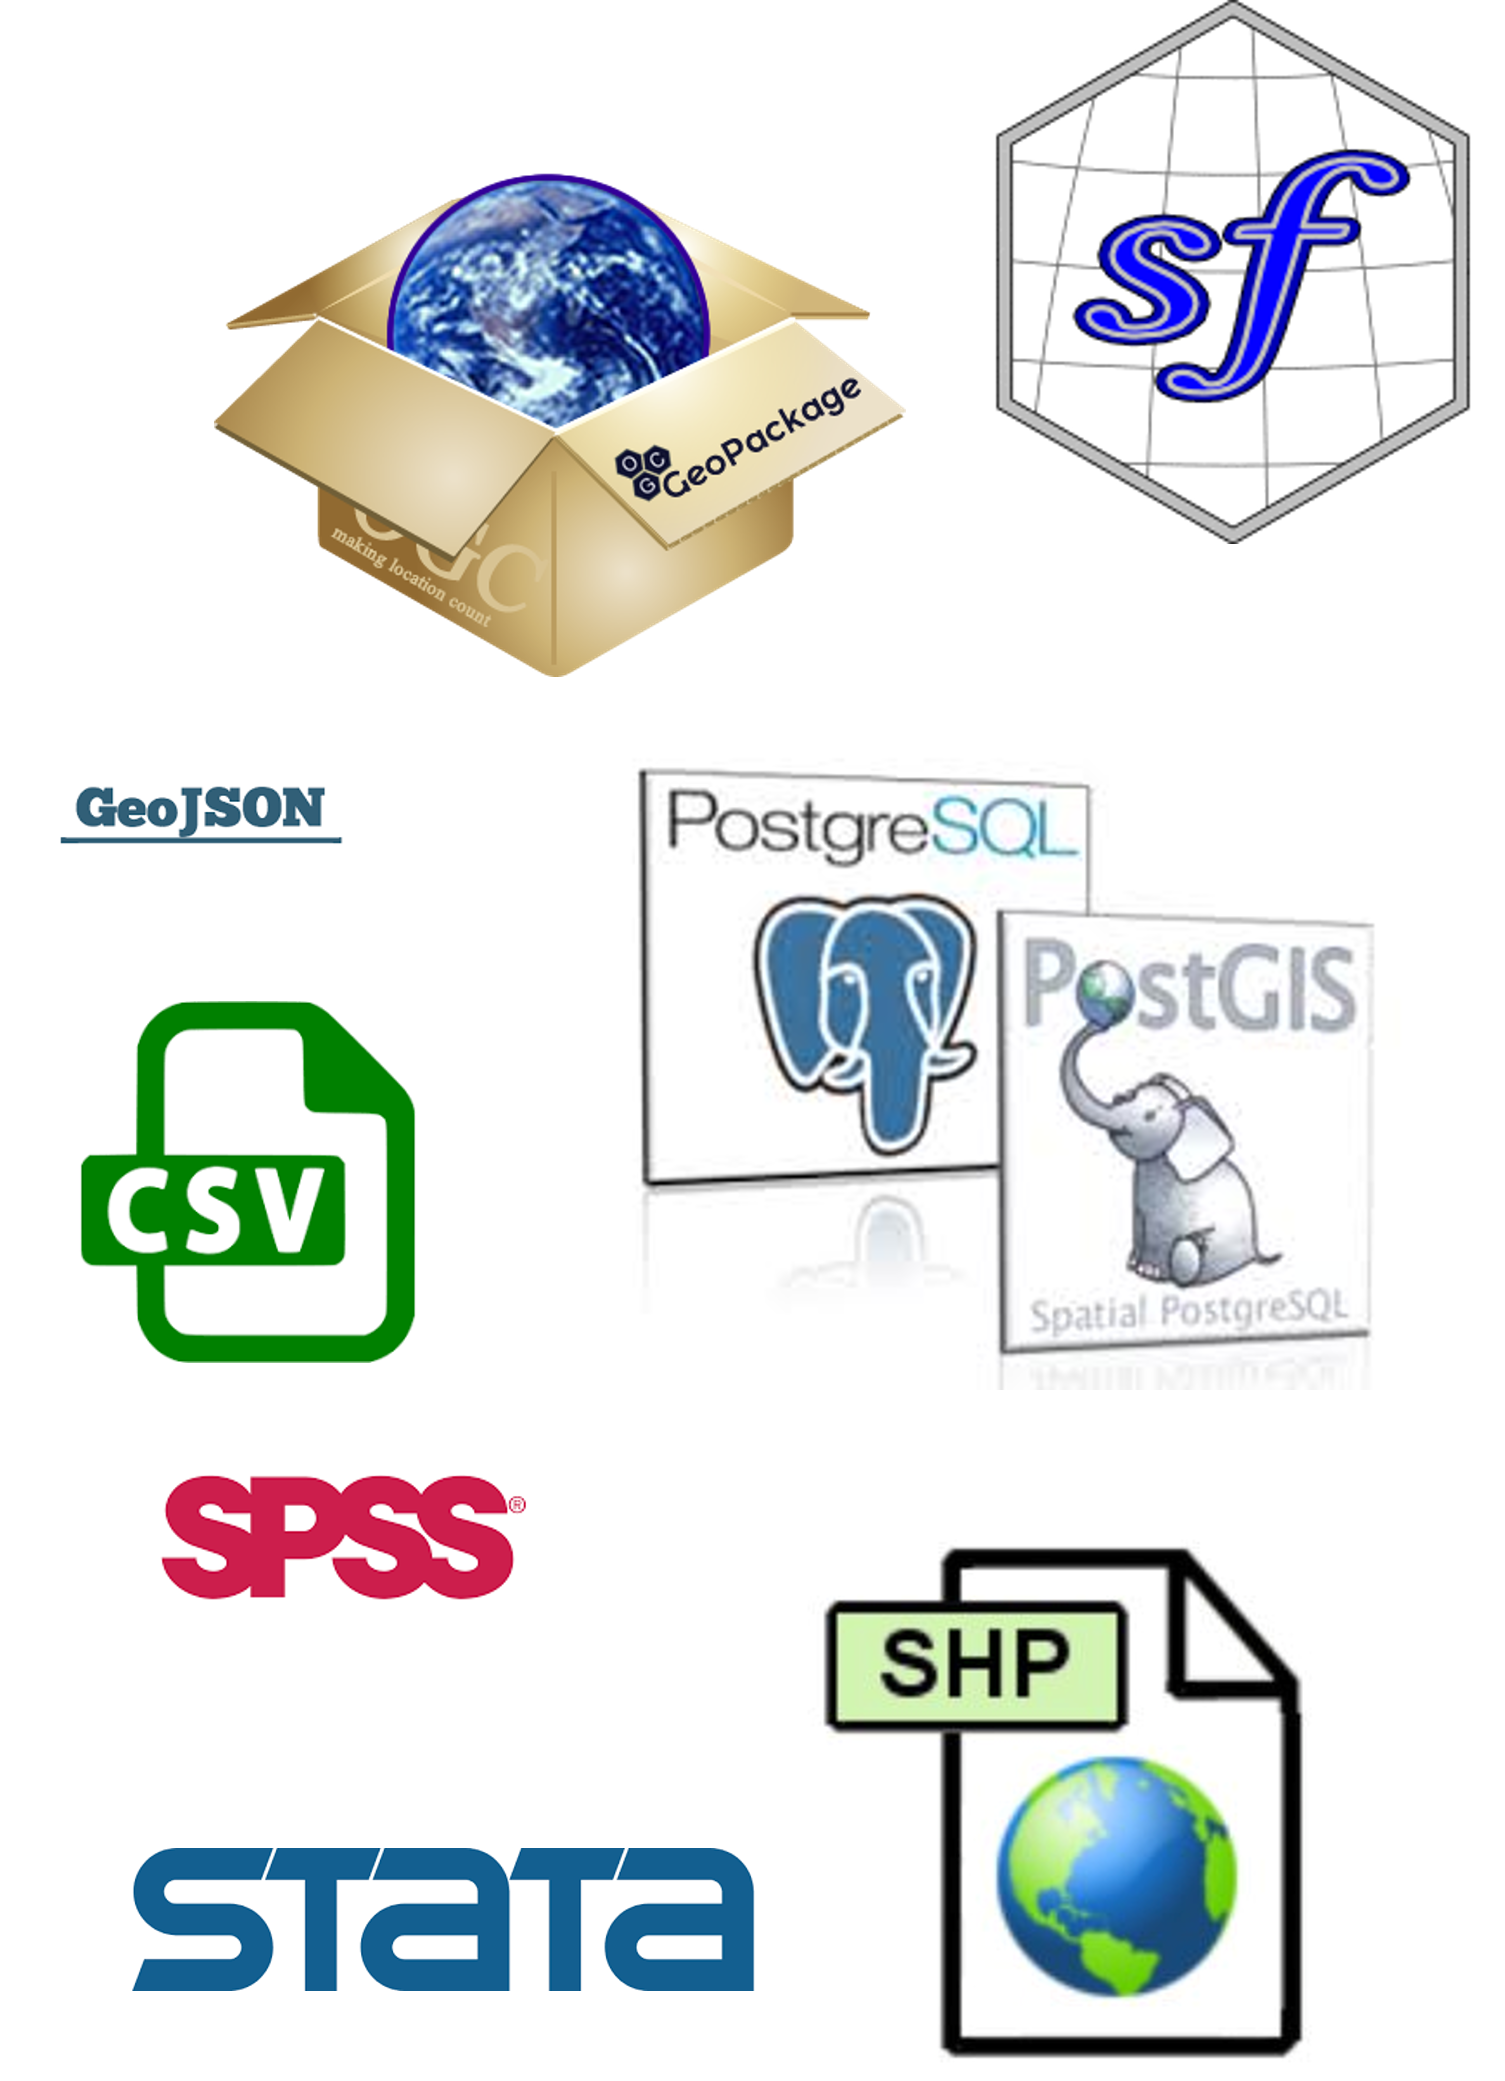
R + Pthyon
Data management/ storage facilitated through connection to a range of file formats (almost any you can think of)
Plus a huge host of software packages for reading, writing and converting data held within these files into a format R can handle
R + Pthyon
What is wrong with this?
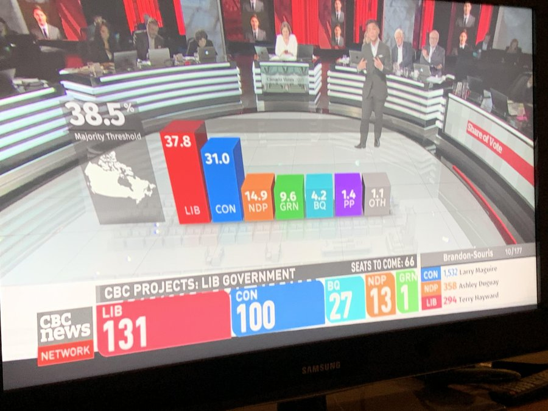
What is wrong with this?
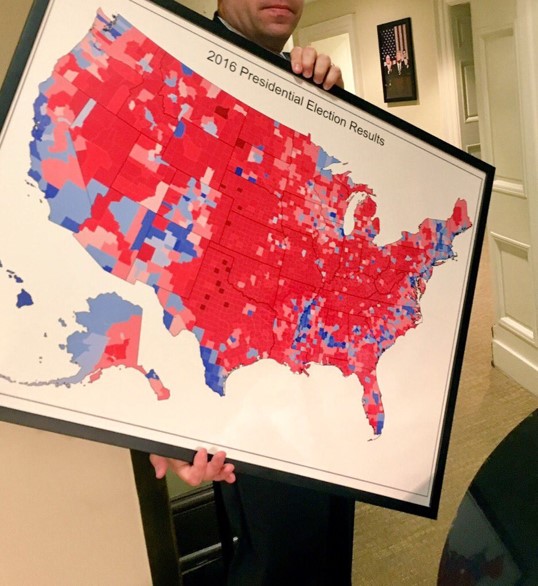
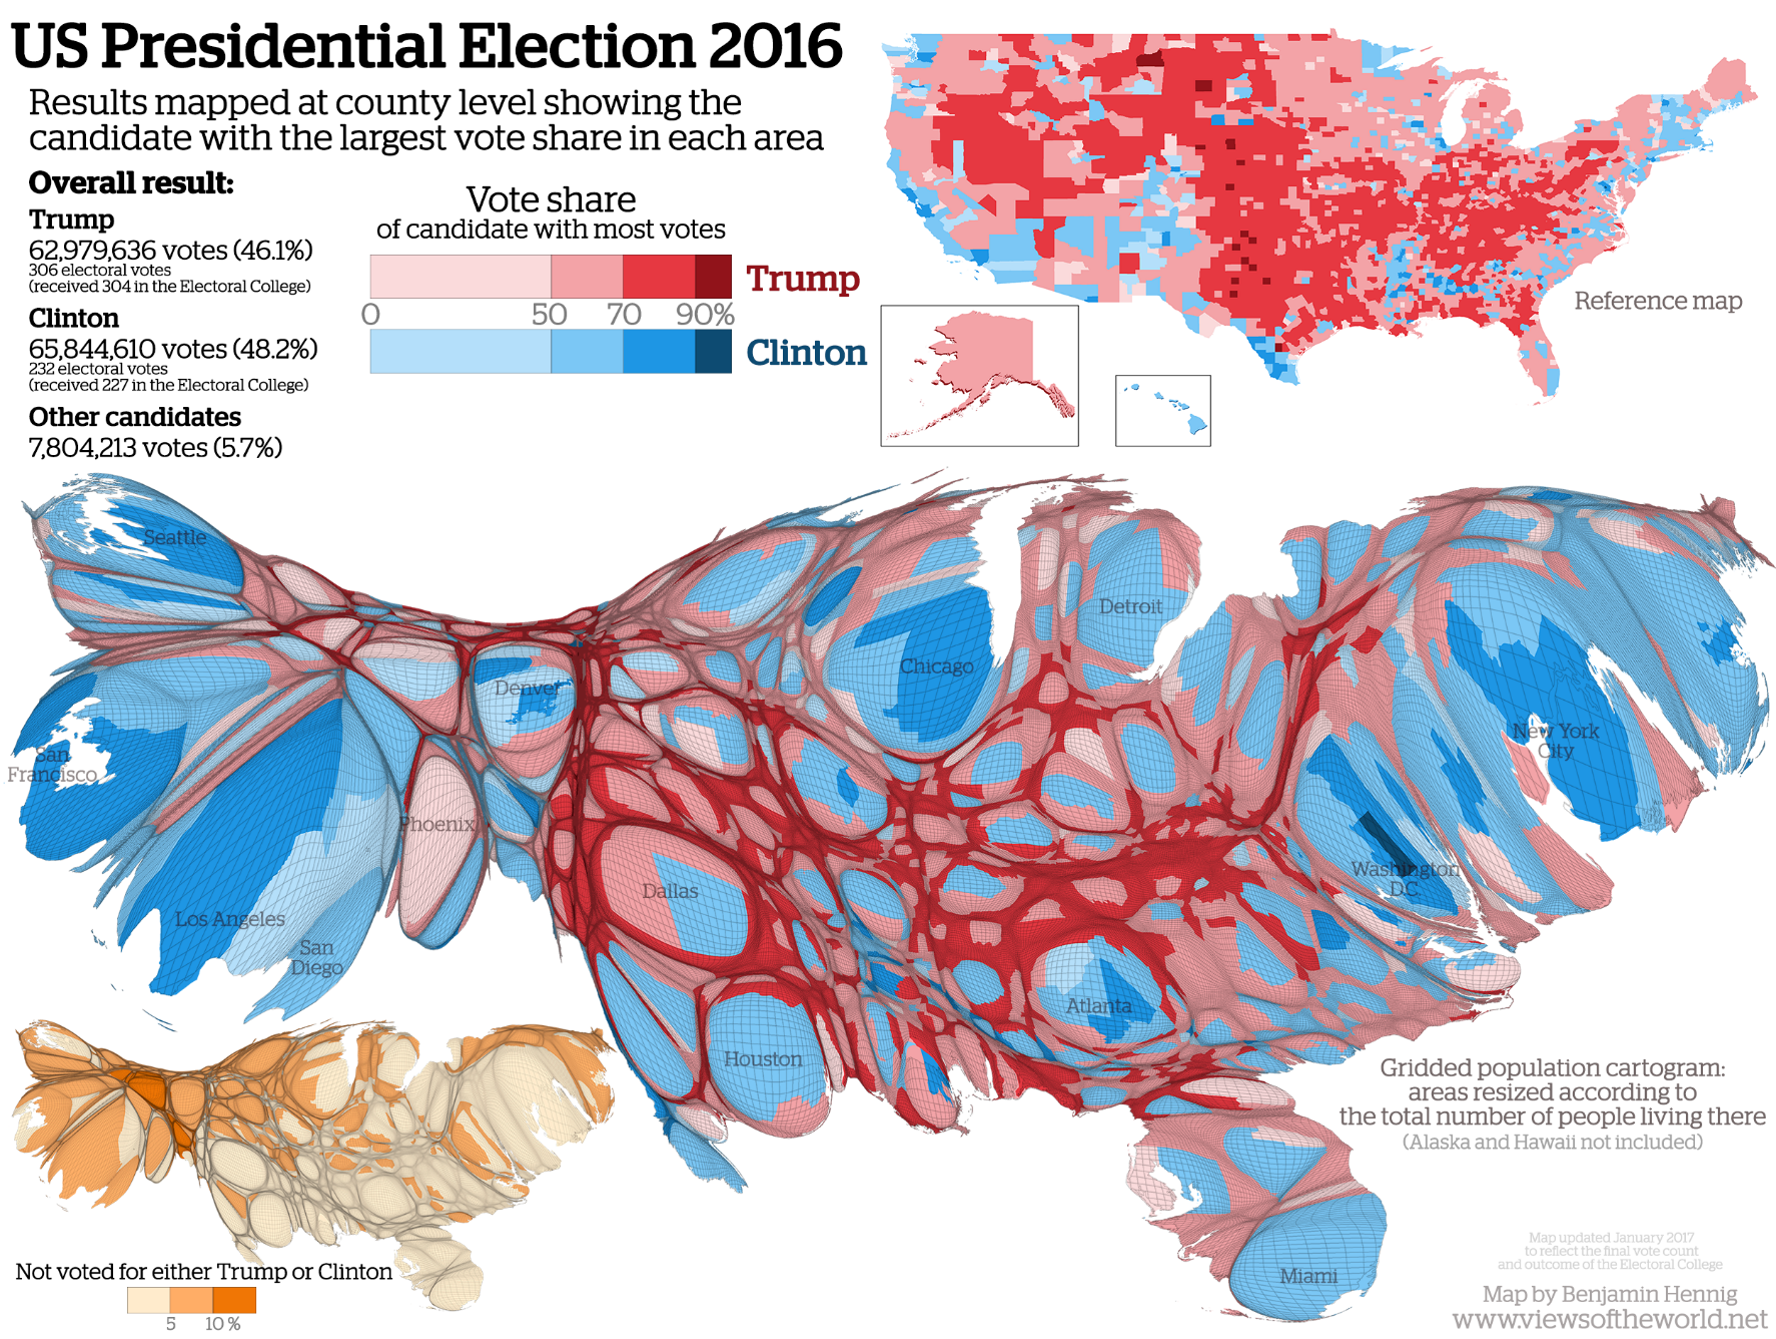
A people based map?
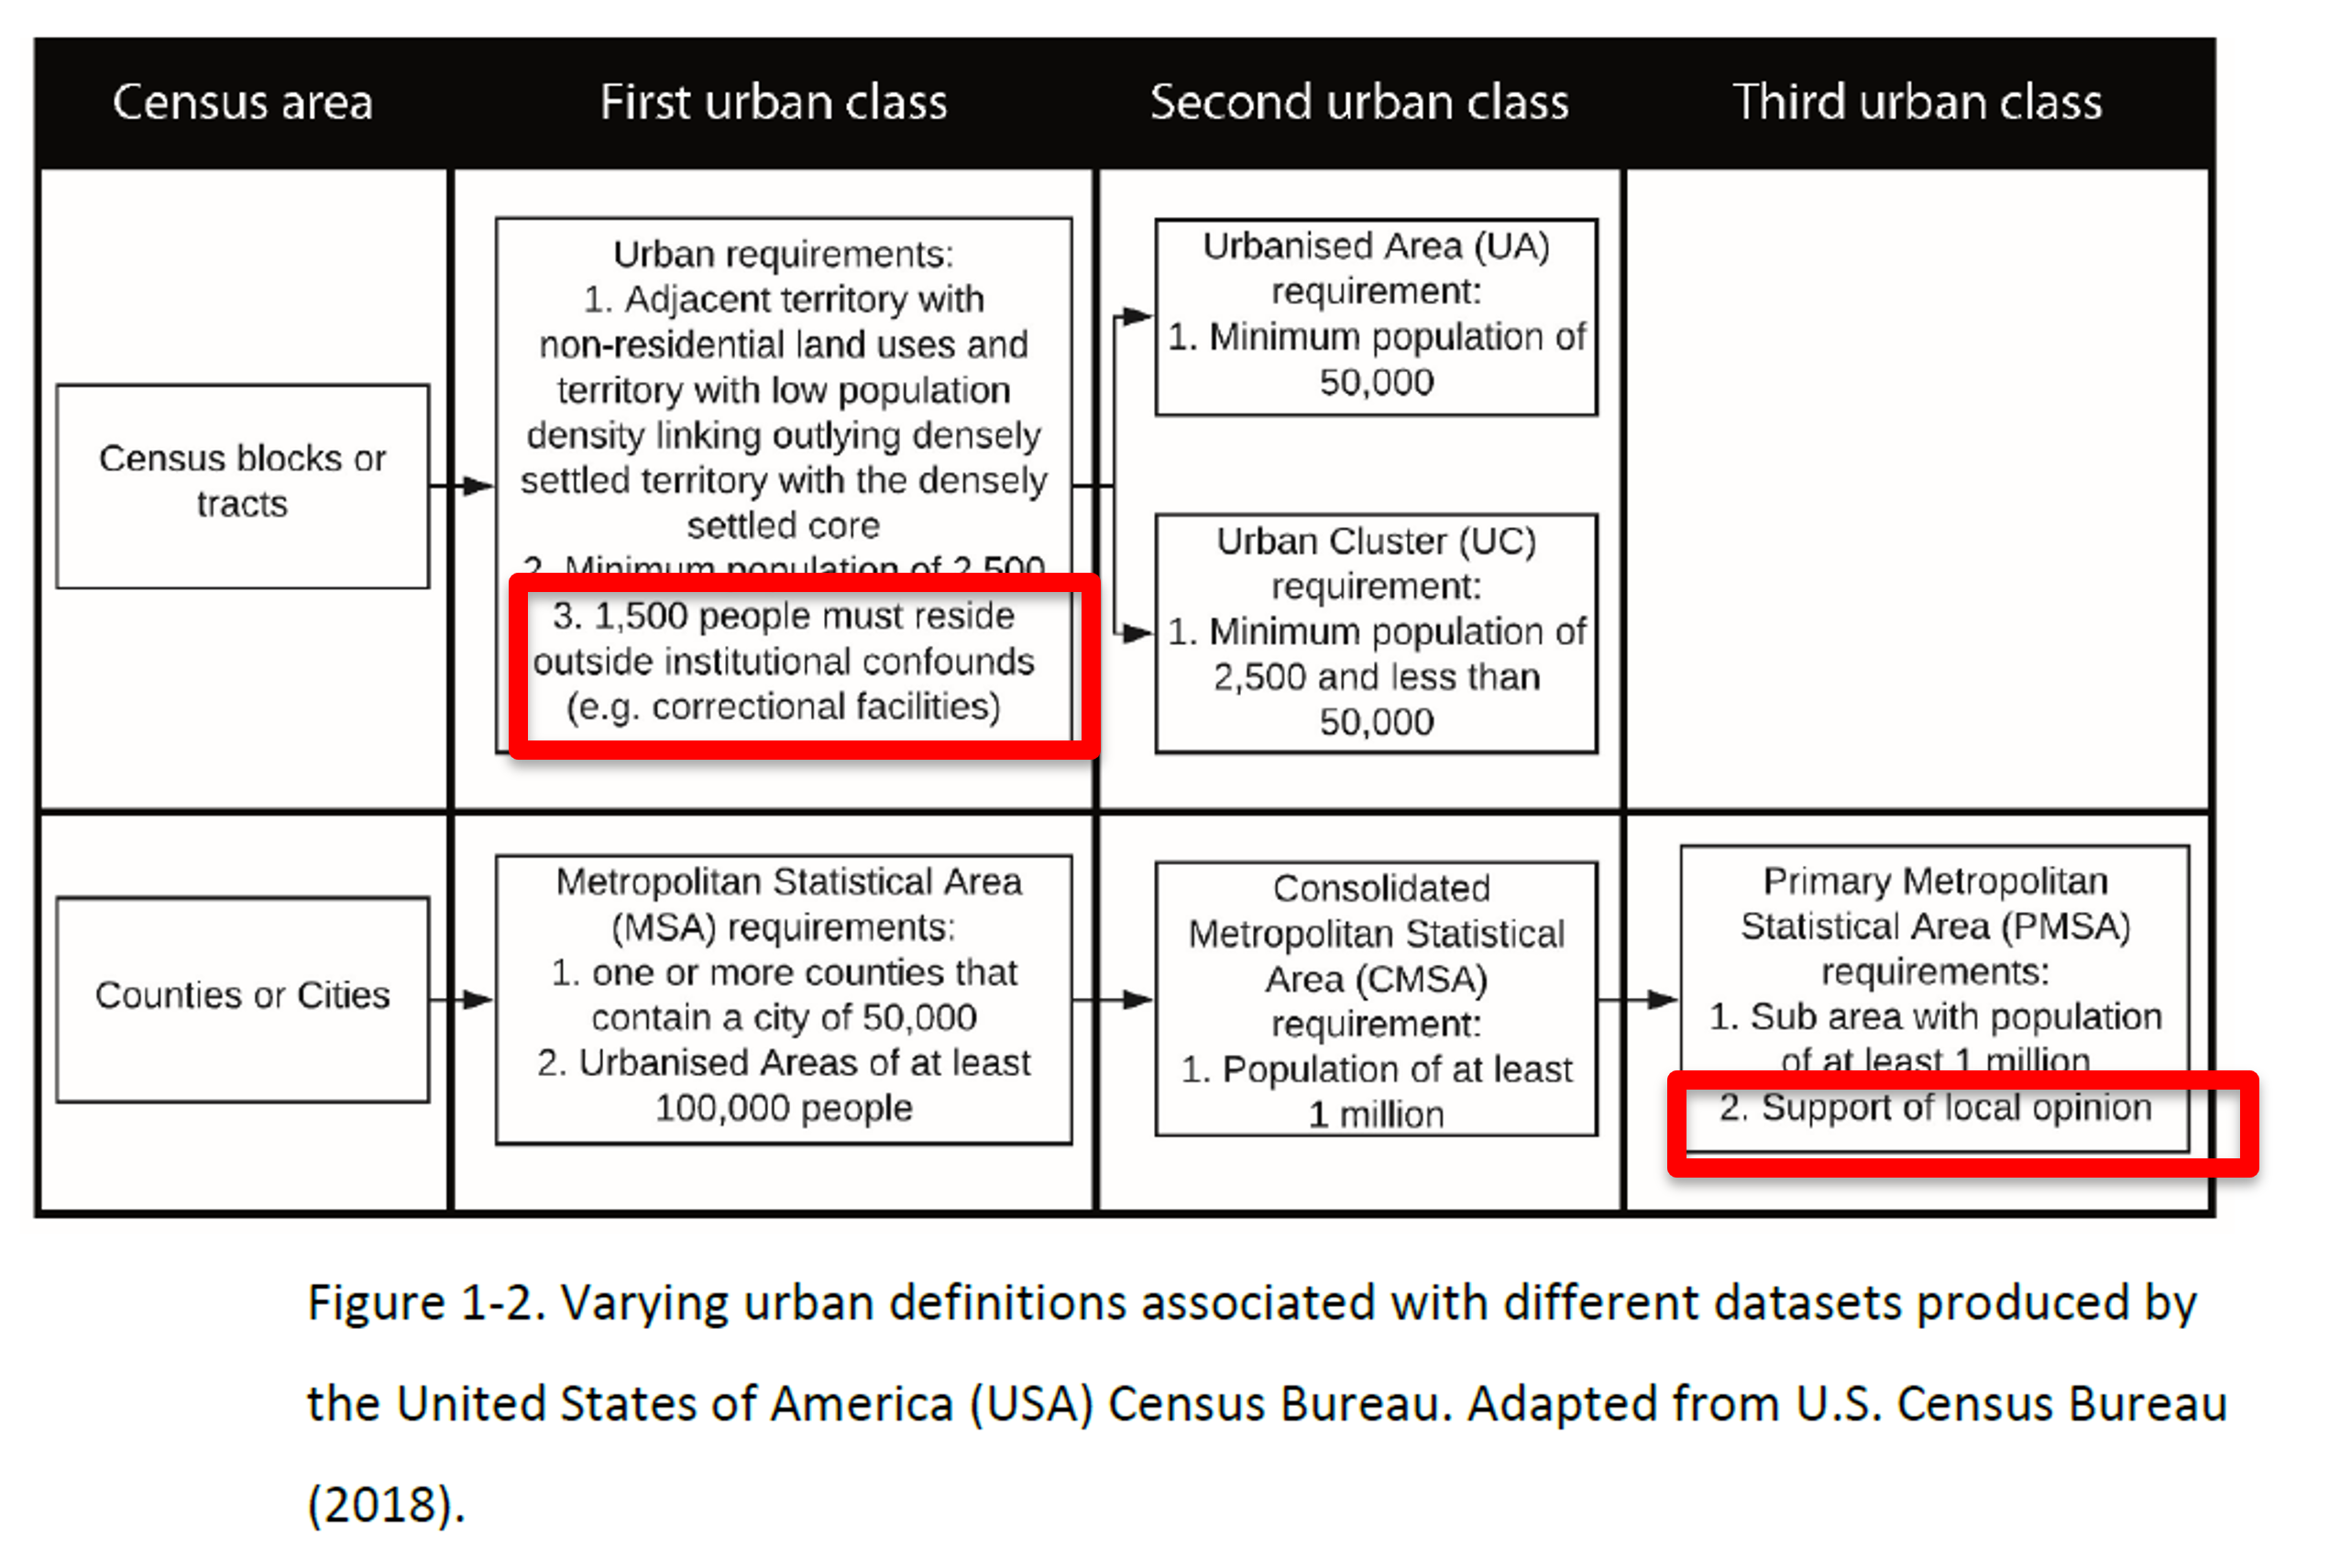
Who has made our boundary data?
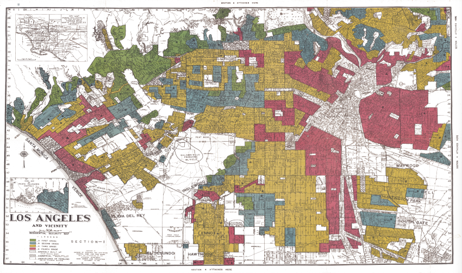
Redlining
- 1930s – American Home Owner’s Loan Corporation – prevent missed payments…residential security maps based on race
- People abandon areas
- Can’t refinance
- Less property tax for services
- Social equity issues remain
- 1968 Fair Housing Act
Who has made our boundary data?
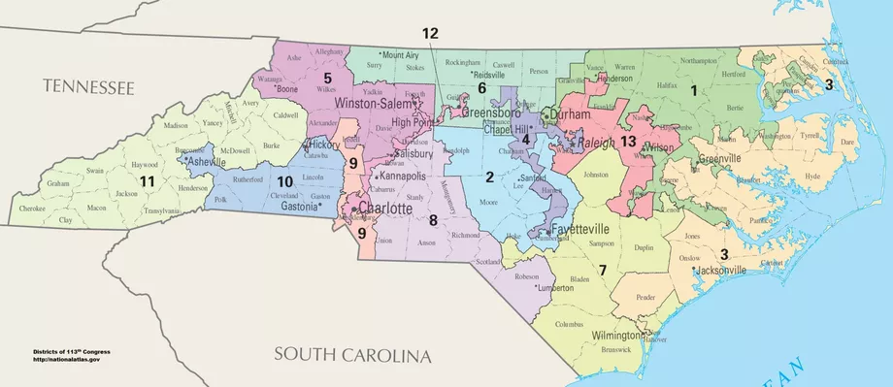
Gerrymandering
Every 10 years electoral districts are re-drawn “redistricting”– Thomas Hofeller (republican) = PACK and CRACK
- PACK = put all the democrat voters in 1 district
- CRACK = sprinkle them out so they never have majority
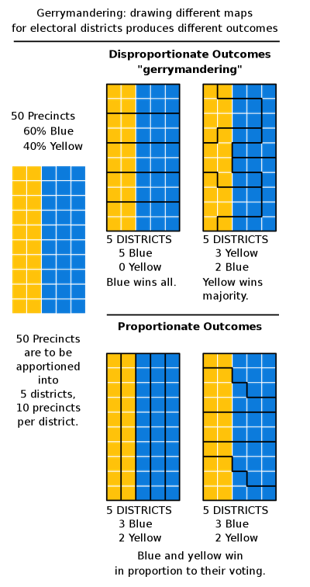

“Redistricting is democracy at work” - Tom Hofeller

Vague concepts?
What is a forest? Conceptual vagueness of geographic concepts. Bennett(2001)
Problematic
What patterns show
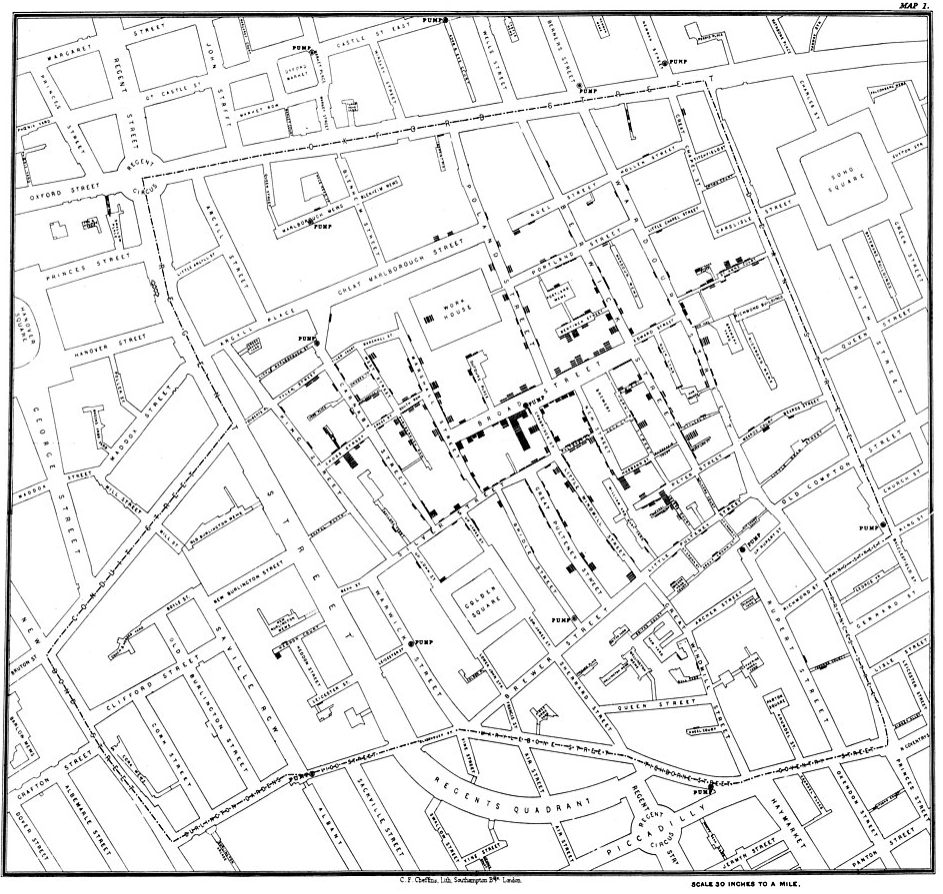
Something in the water: the mythology of Snow’s map of cholera. Source:Kenneth Field
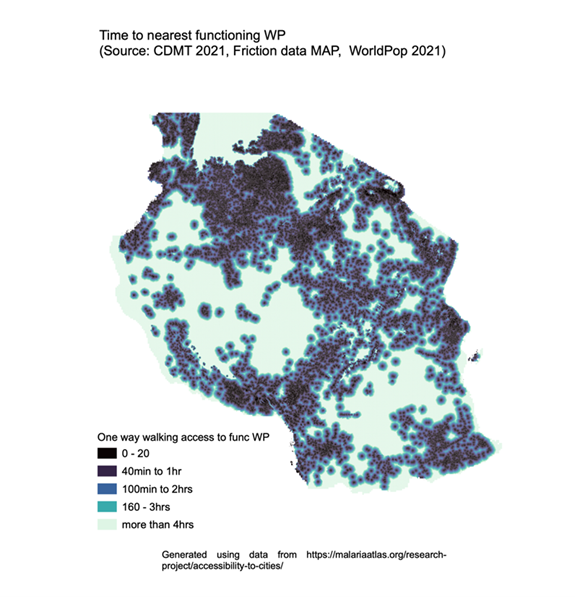
Spatial Epidemiology: Lung Cancer
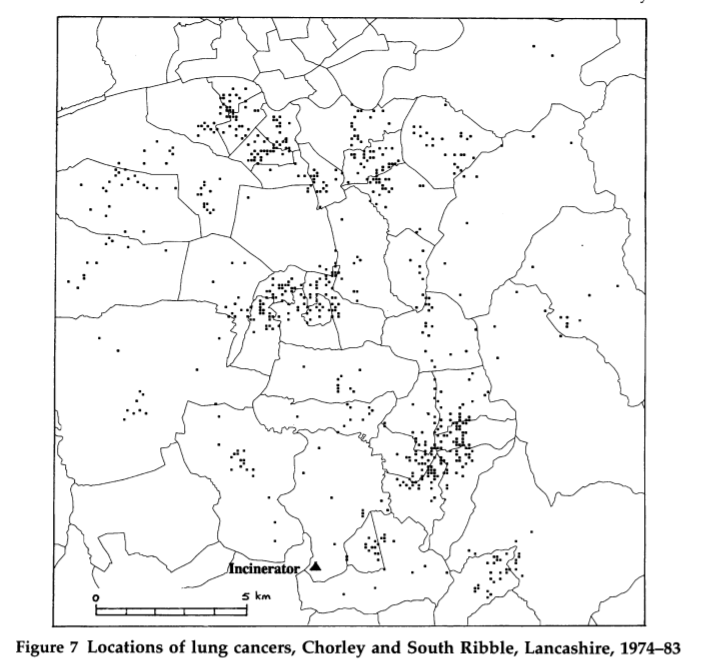
- Similar methods that we will use today - incidences of lung cancer relative to the physical envrionment - are they clustered and where?…leads to why
- are the locations of lung cancer similar?
- Does the incinerator have any influence ?
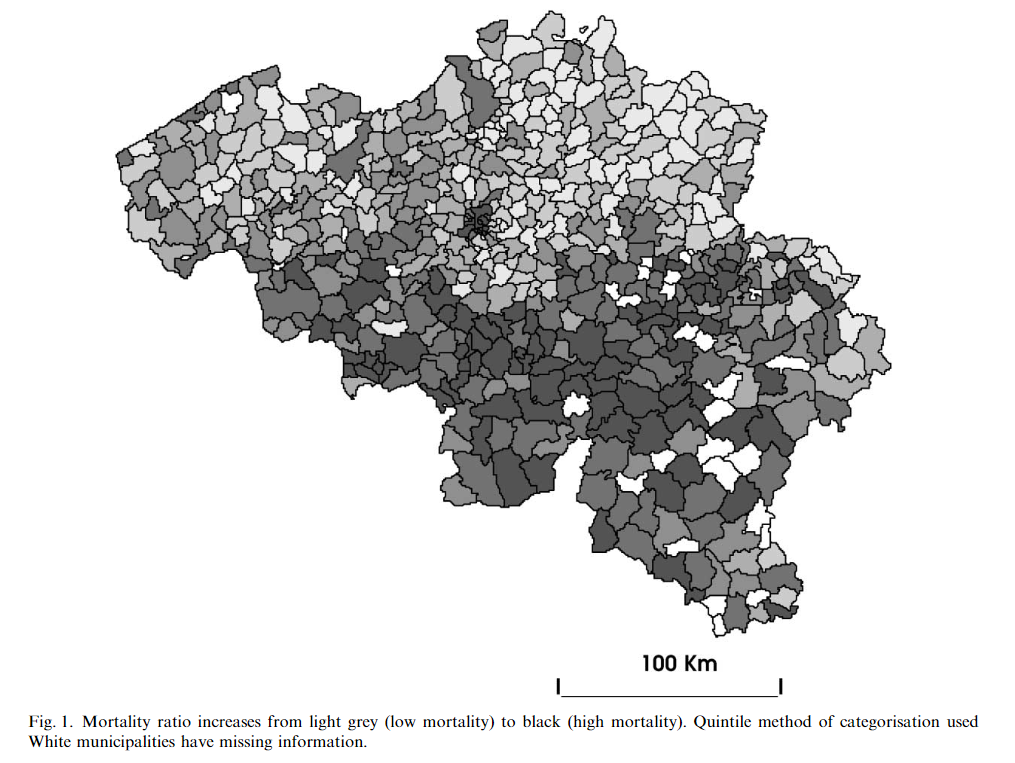
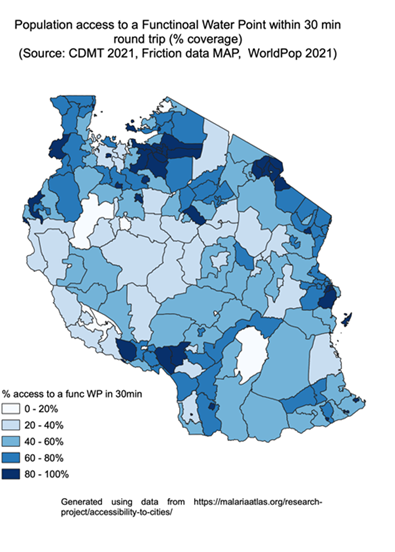
Spatial Epidemiology: Mortality
- Similar values might suggest there is something more going on
- Some sort of spatial influence
- Note the difference between spatially continuous and point data
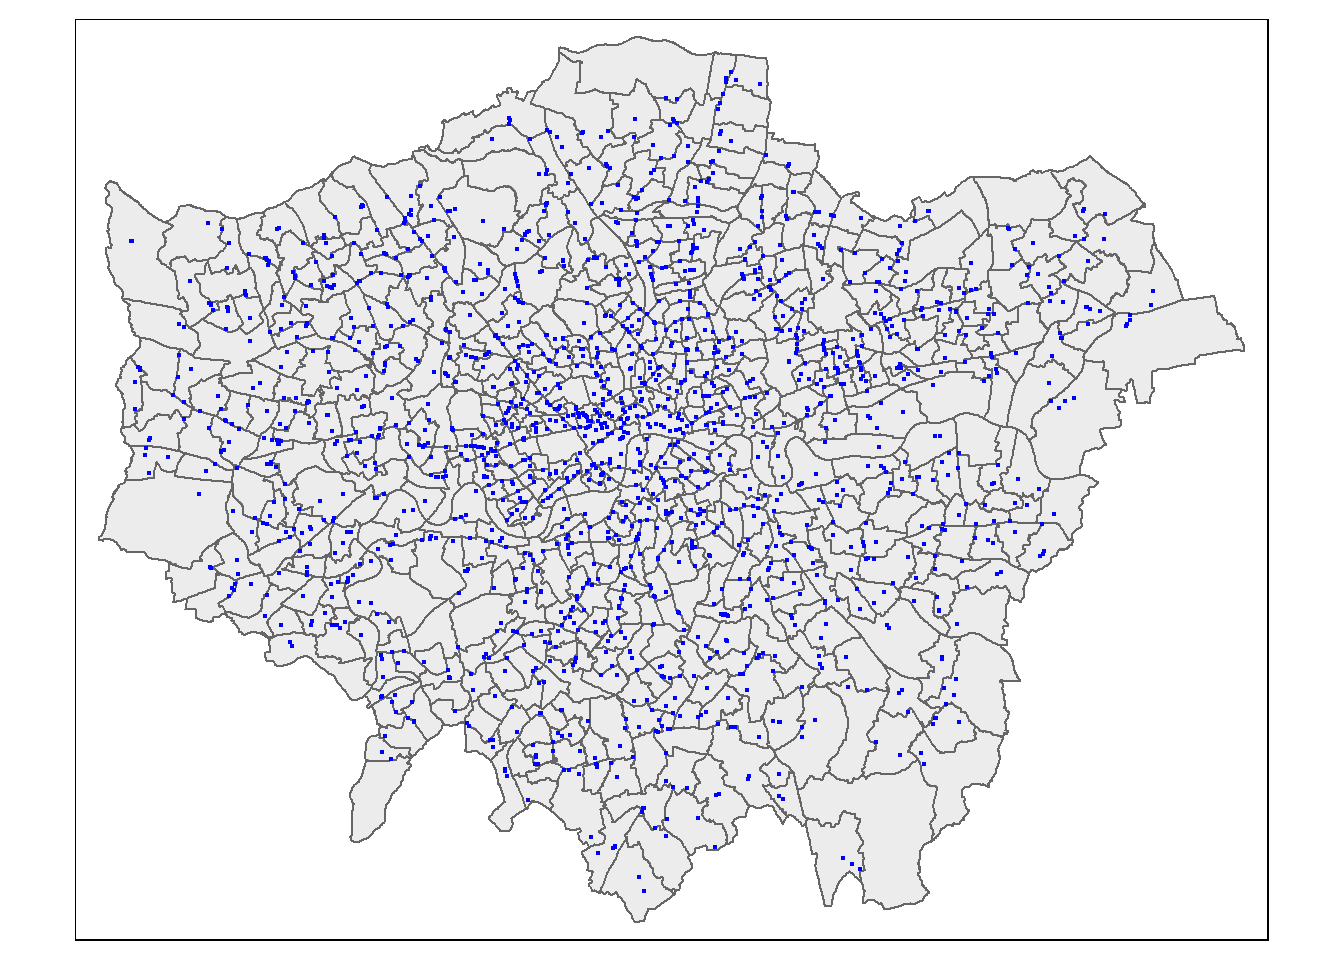
Examples
Question: Are the points clustered or are they random?
If we identify clusters what are the socio-economic characteristics ?
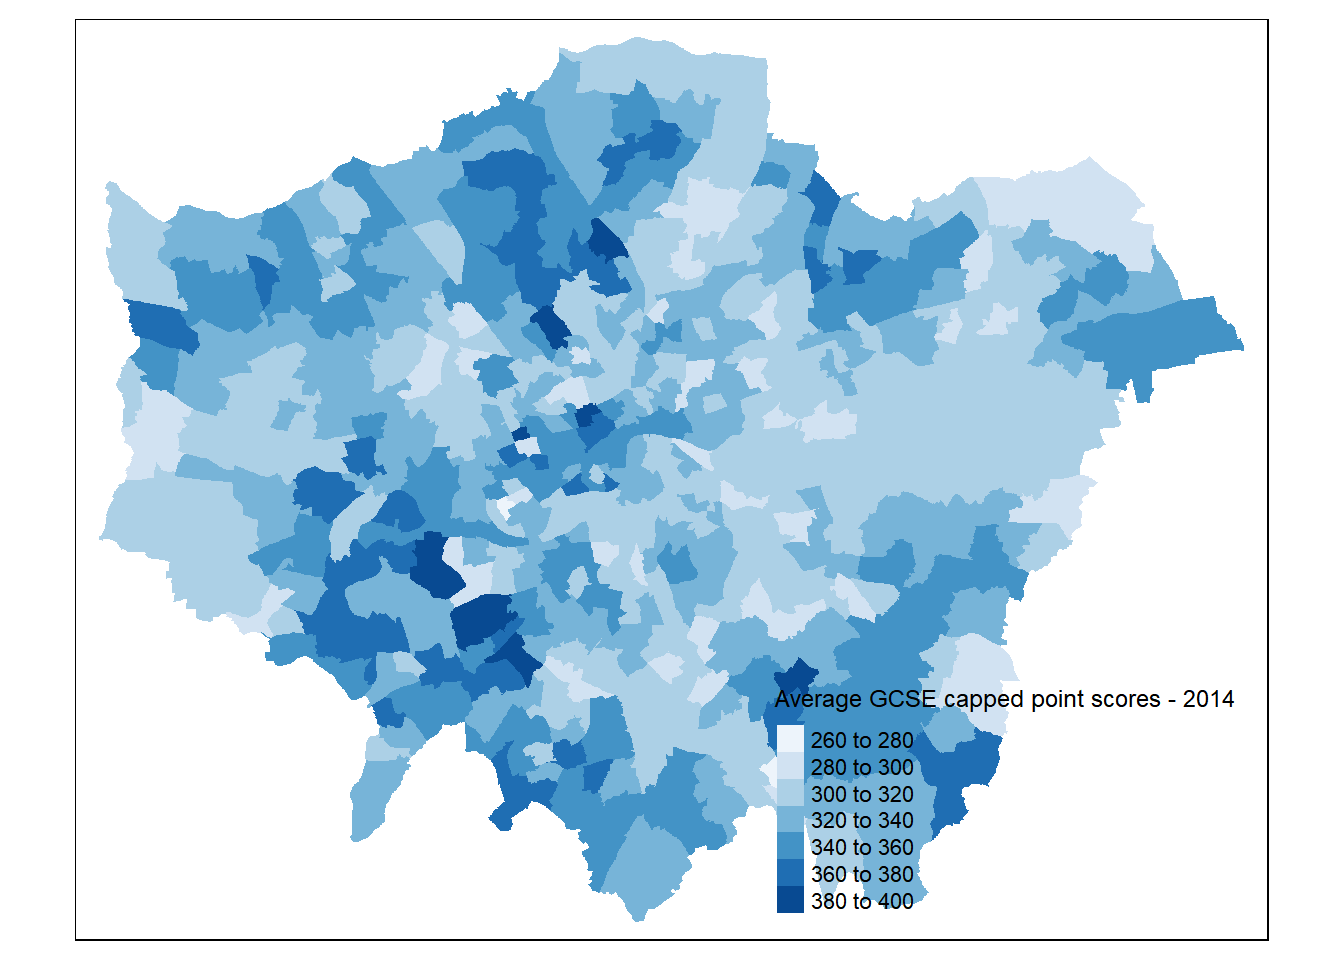
Examples
- Question: Are the values similar between certain wards?
Spatial modelling
What are the factors that might lead to variation in Average GCSE point scores across the city?
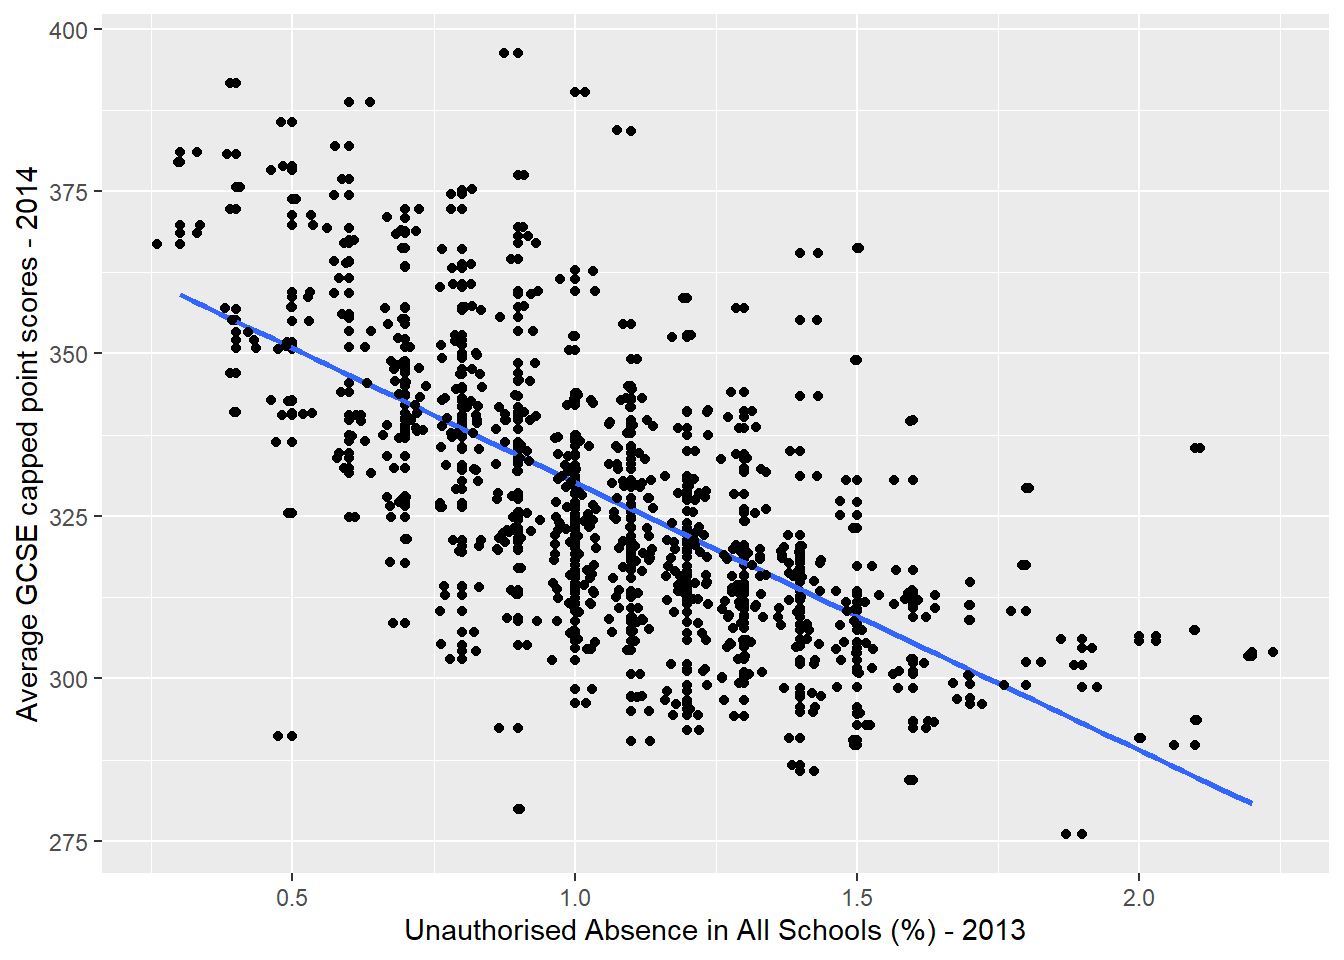
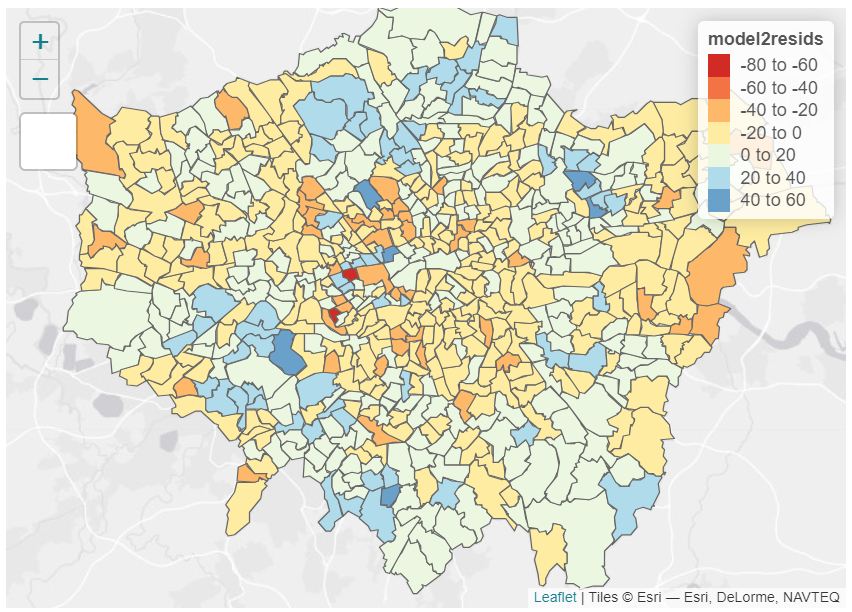
Spatial regression
Here we haven’t accounted for the influence of a neighbour…
In our model the residuals (observed-predicted) should show no pattern (or autocorrleation)…in other words they should be random!
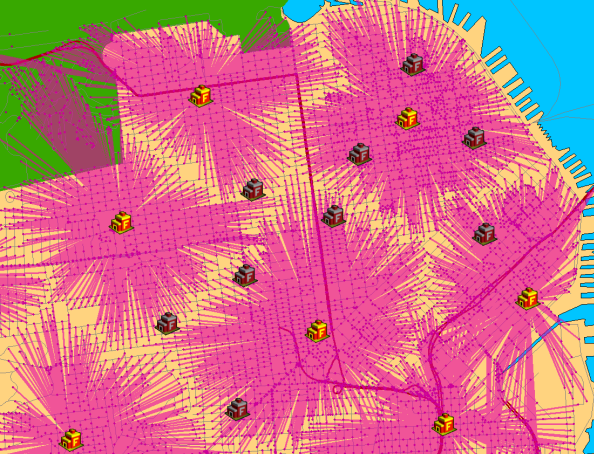
Networks / location allocation
You are in charge of a supermarket chain and you want to open a new store
You work for a delivery company and want to locate a warehouse
In the event of an emergency call, where is the nearest fire station / ambulance / police car?
Great…however…
food deserts’ where people are likely to pay a higher cost for their weekly food shopping and have to shop in more expensive small convenience stores with a limited stock of good value fresh products.
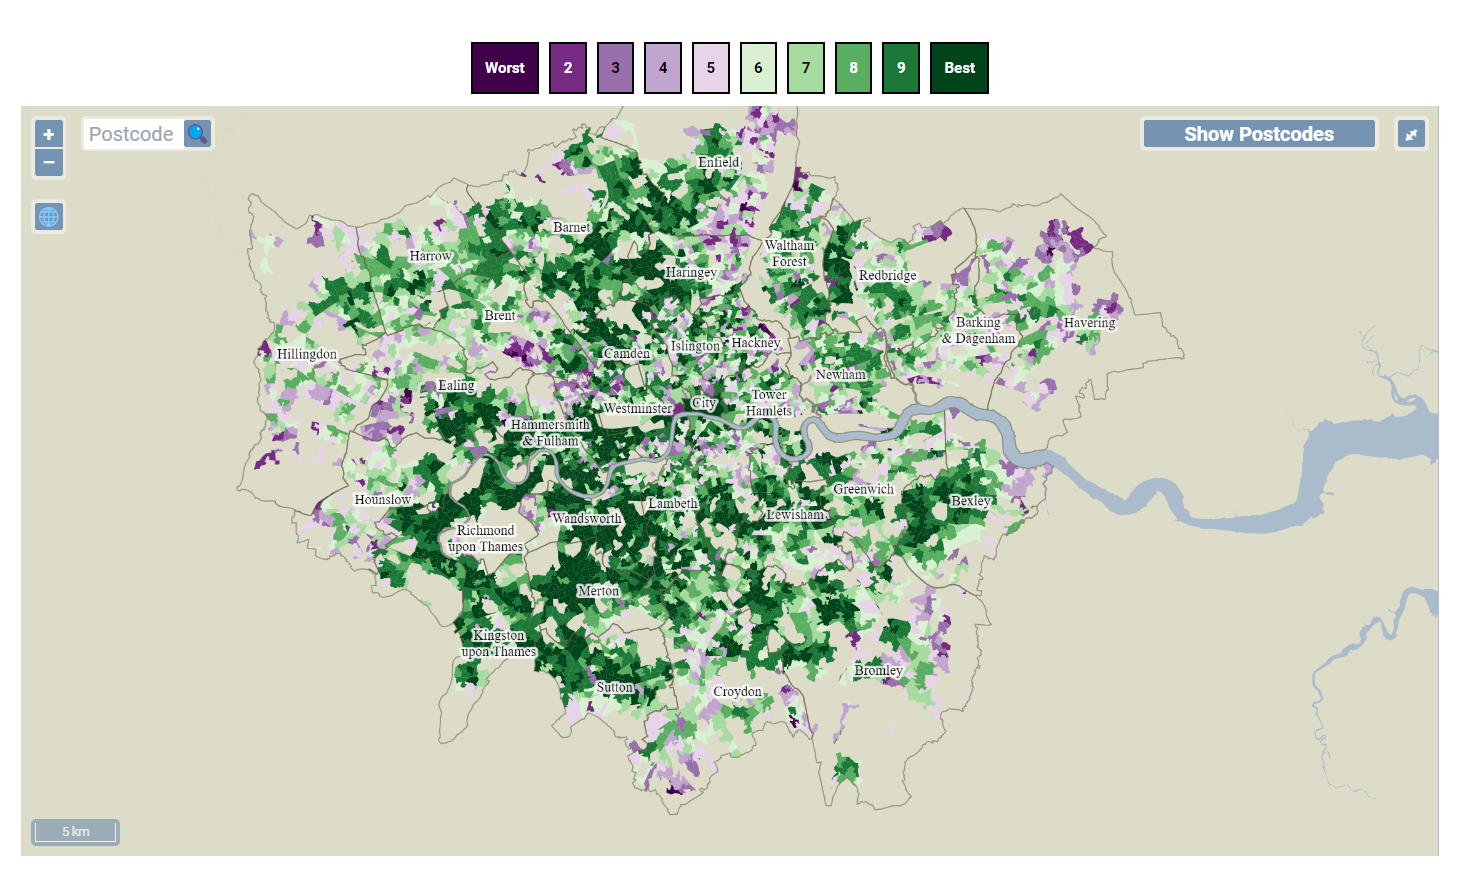
The E-food Desert Index (EFDI) is a composite index which measures accessibility to groceries. Source:Trust for London
More poweful analysis
Instead of just using the network we can now combine public transport, elevation, use timetables and set parameters such as maximum waiting time using R5R
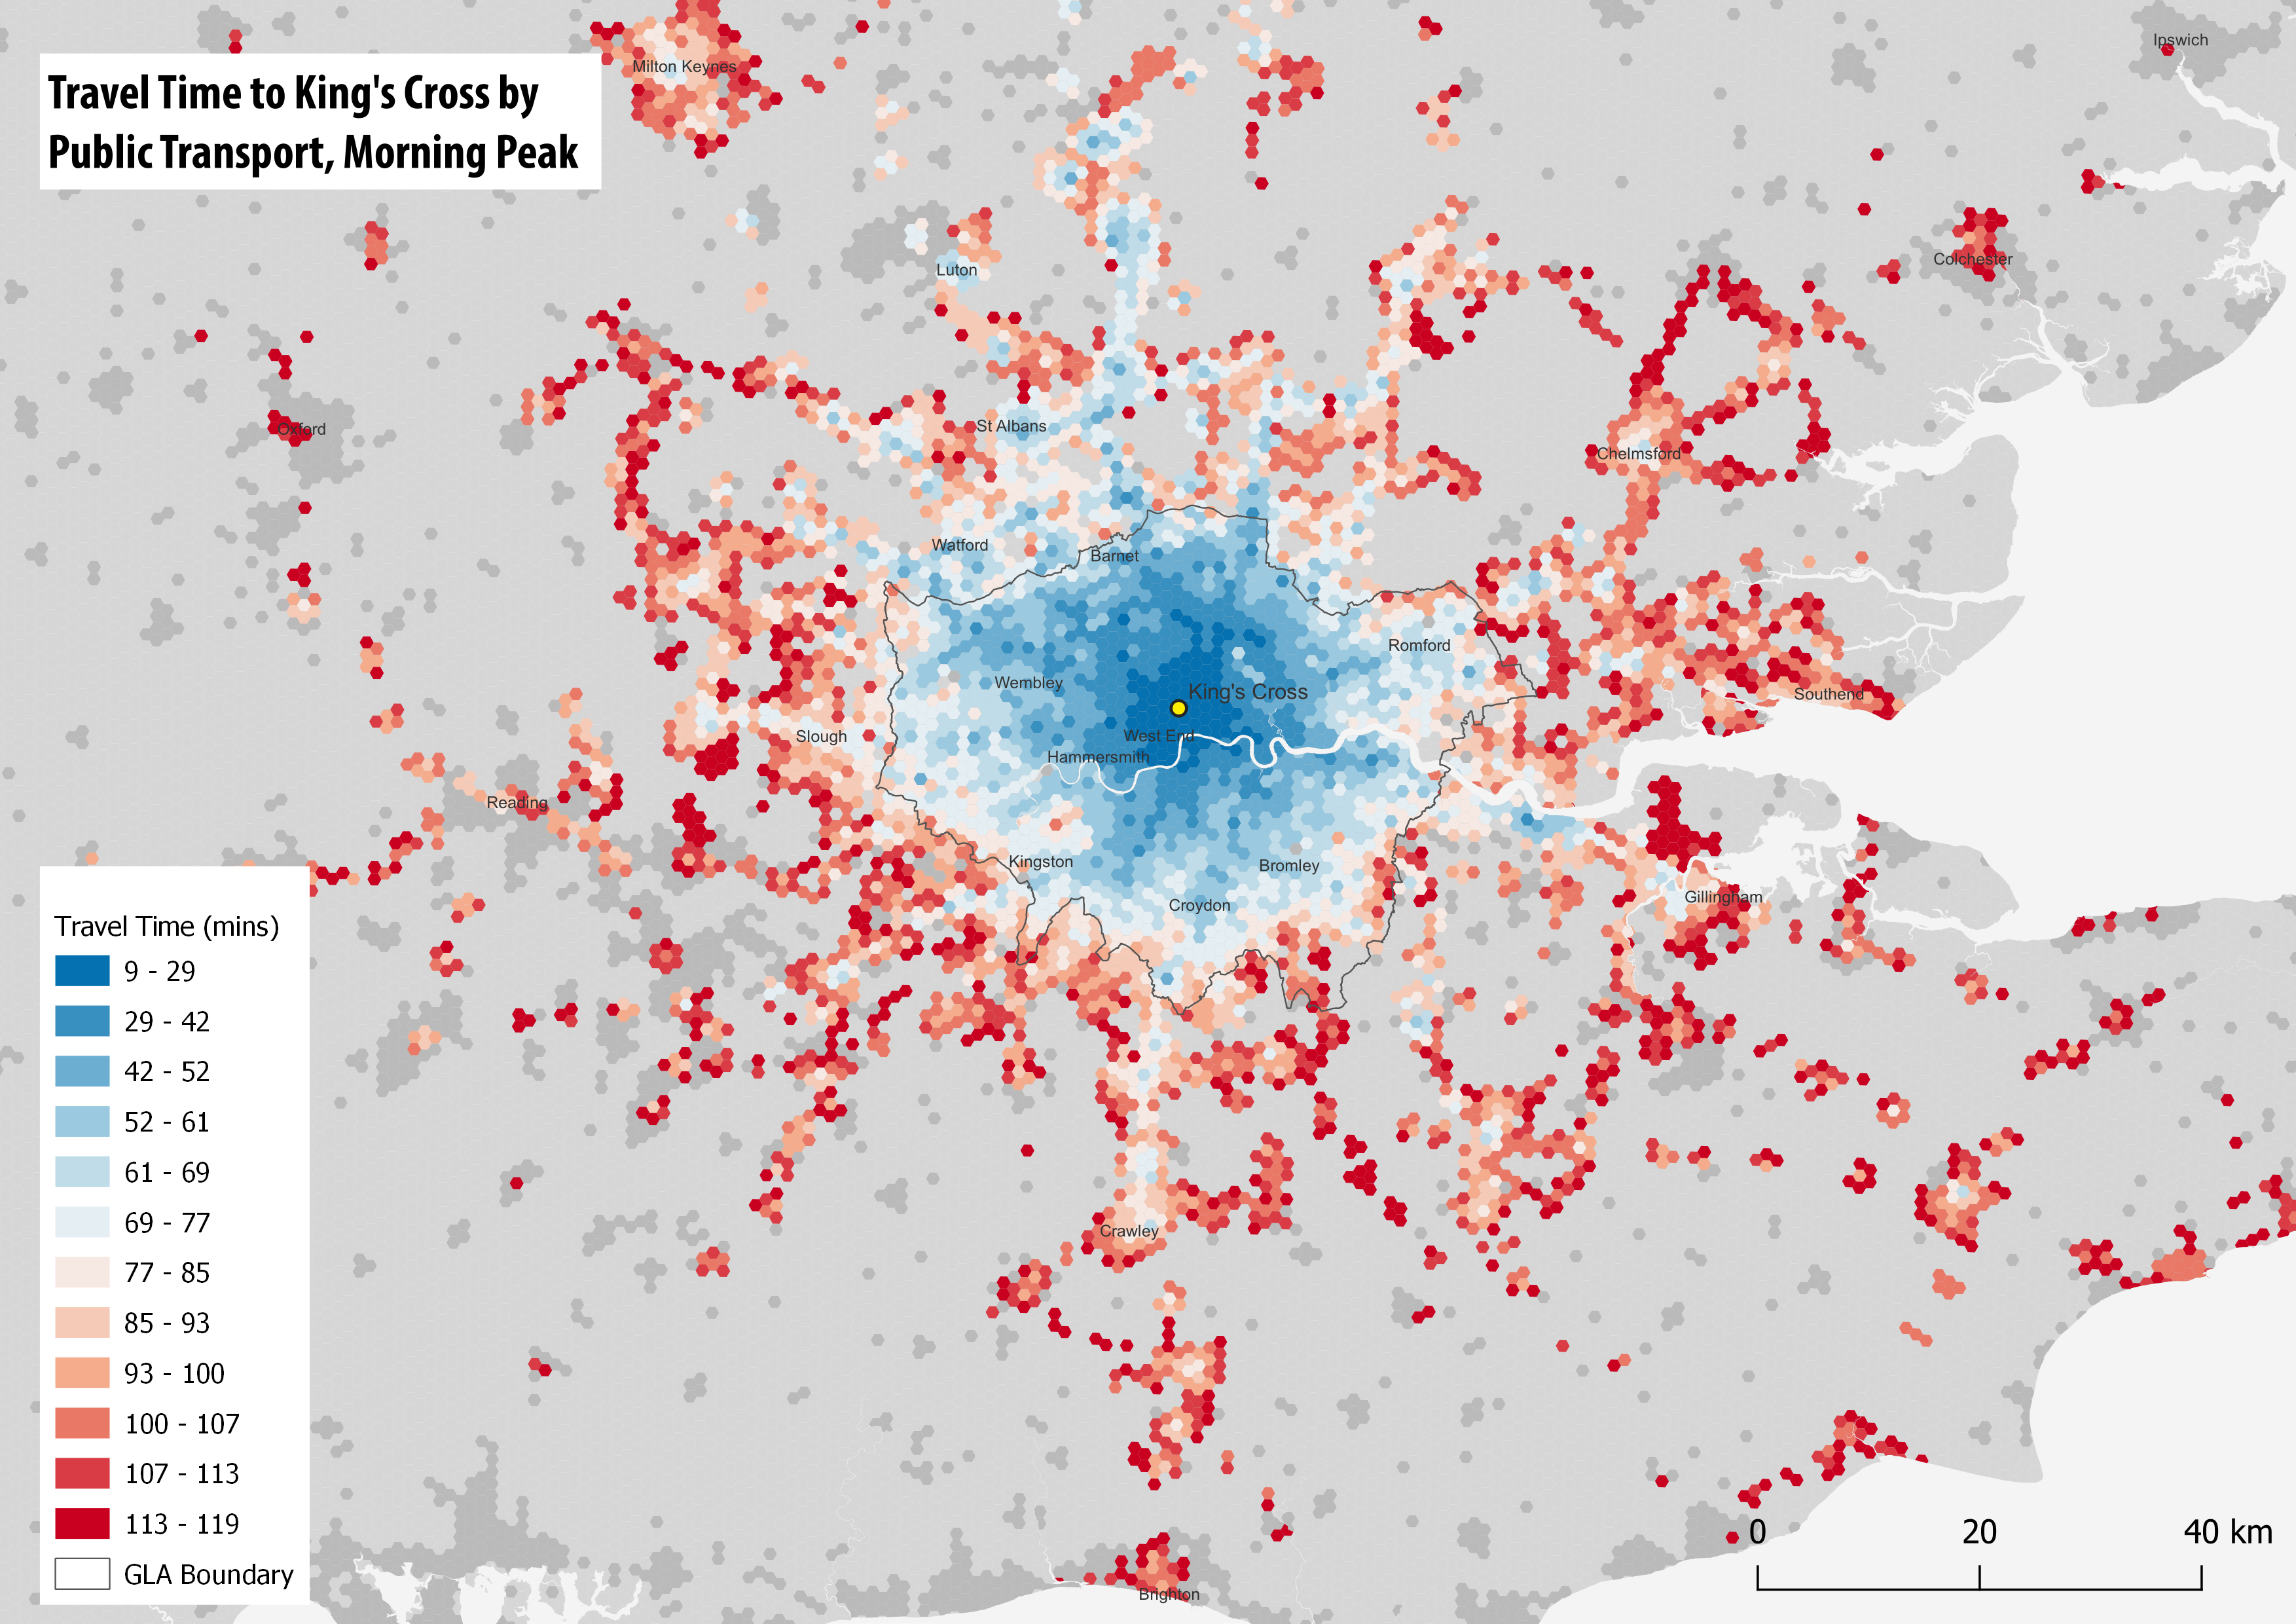
R5R example. Source:Duncan Smith
Cost distance analysis
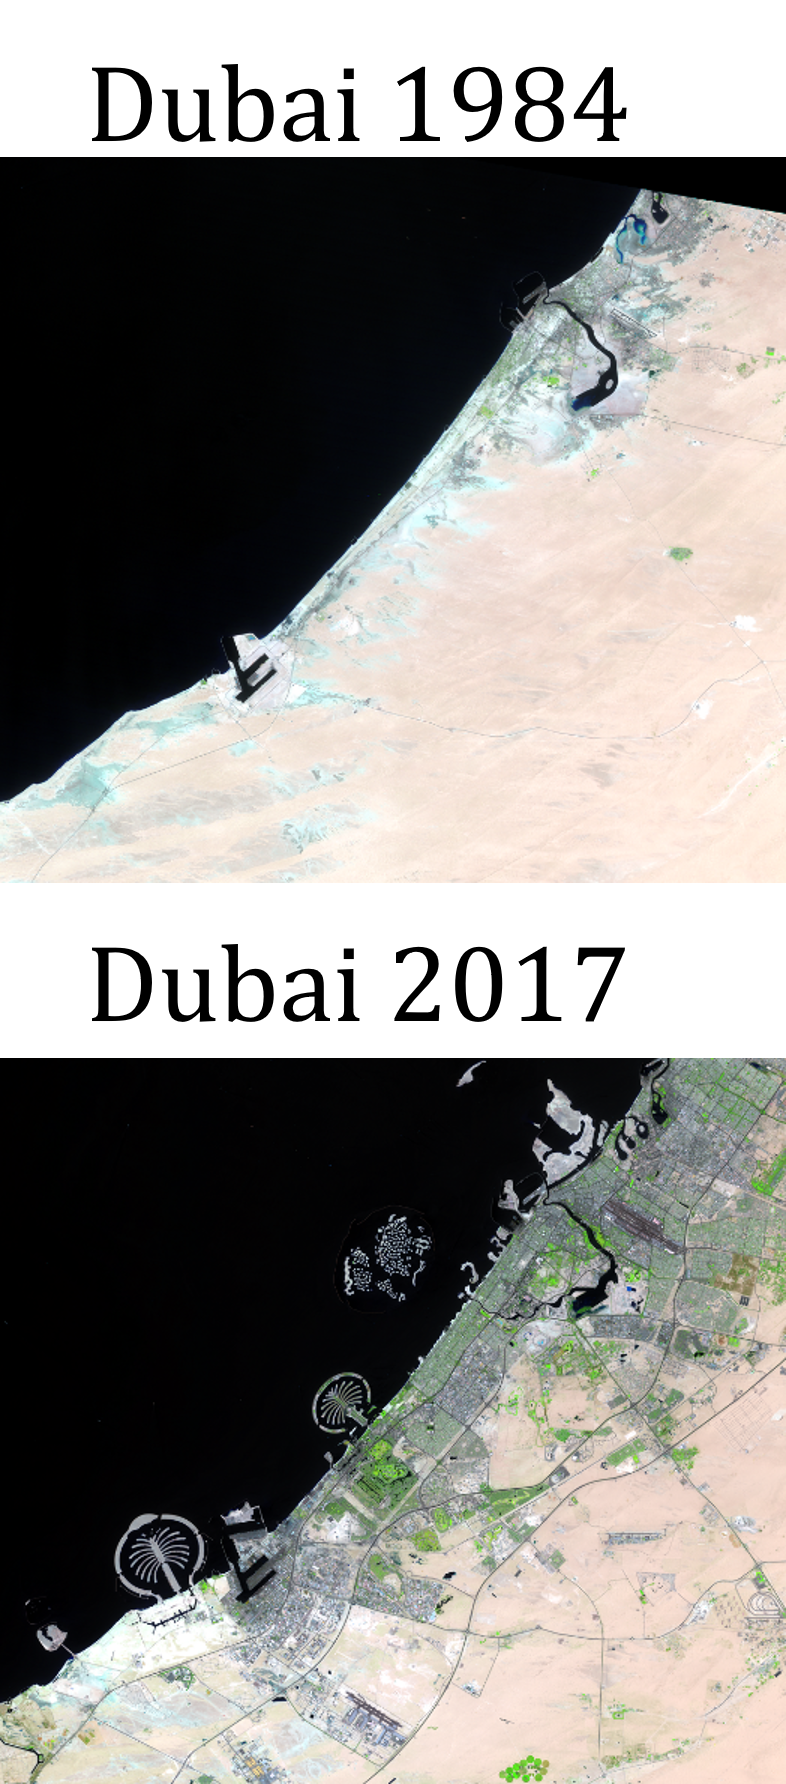
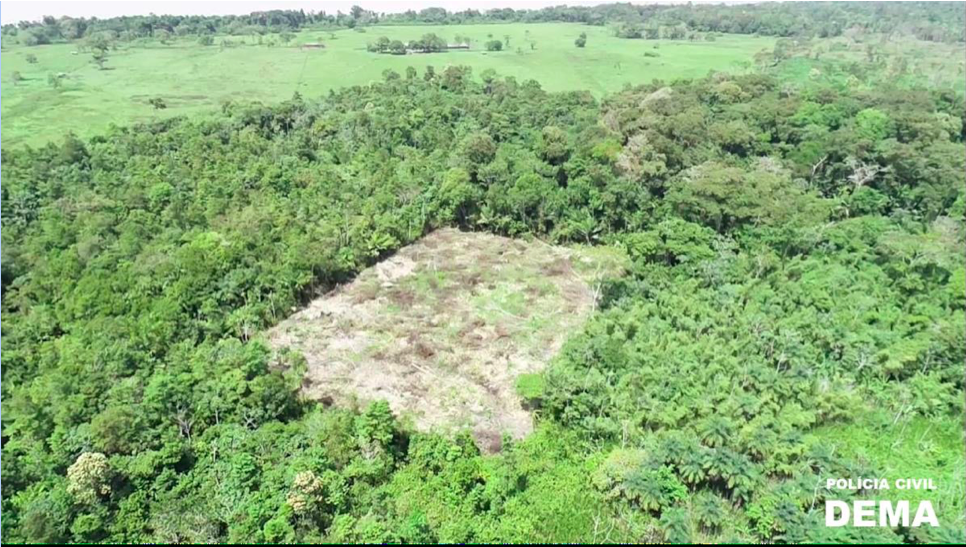
Earth Observation 1
Leonardo Brito became chief of police at the Police Specialized in Crimes Against the Environment (DEMA) in Brazil’s Amapá stated, he noticed that the department hardly ever investigated environmental crimes
2 employees, two vehicles, a boat and a drone, which collects only 20 minutes of footage at a time, to patrol an area of forest the size of Nepal.

Earth Observation 1
Brito said that since they starting using the app, Amapá’s environmental police have been able to detect 5,000 areas of deforestation in the state, both legal and illegal. He adds that every day he sees new locations to add to the ever-growing list.
Trying to clear small patches to avoid detection!
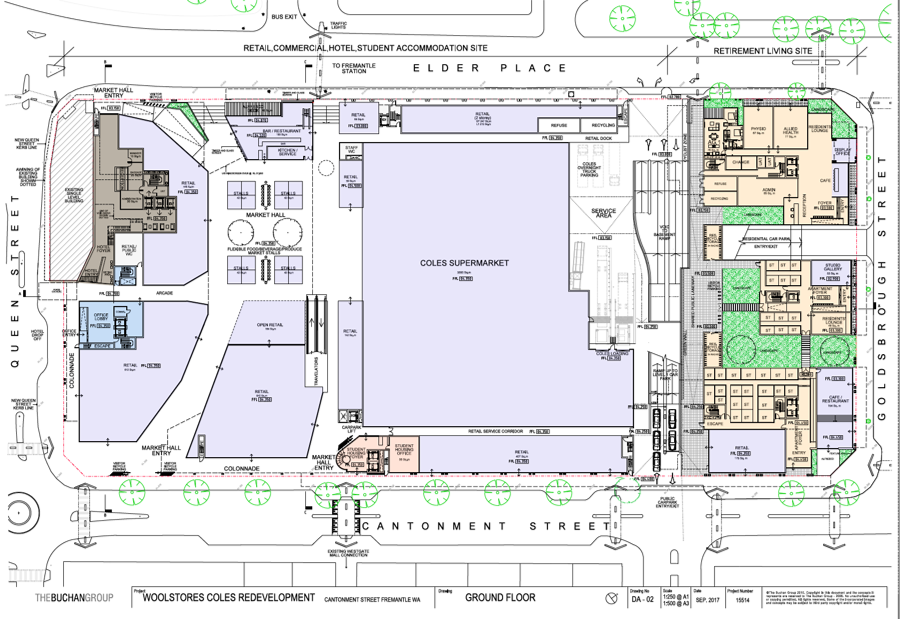
Earth Observation 2
Fremantle Woolstore, Western Australia


An example….UHI
Data
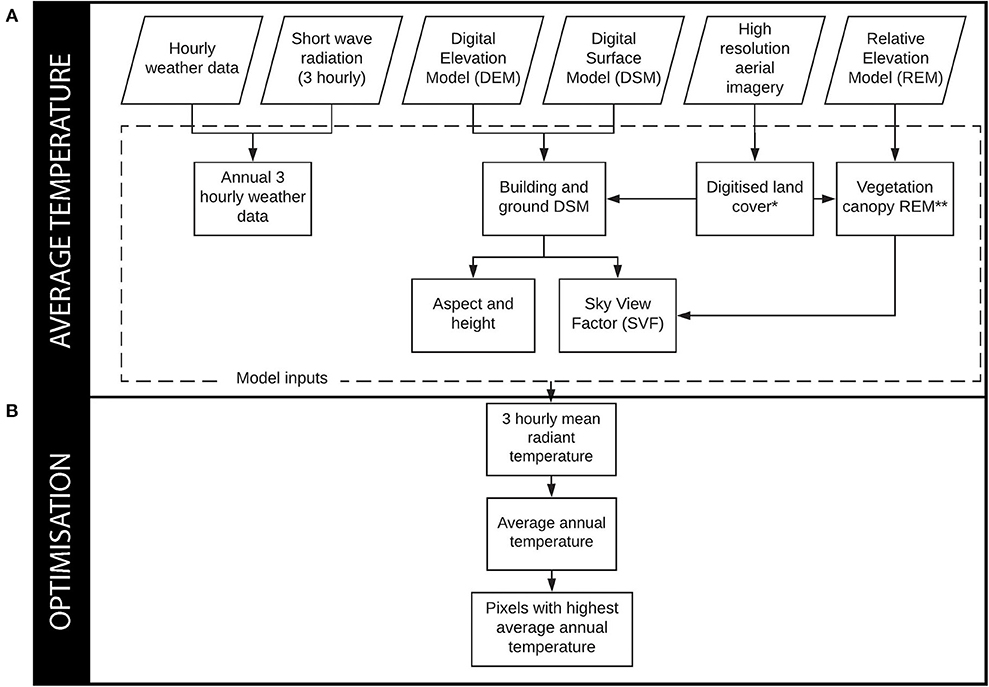
Models
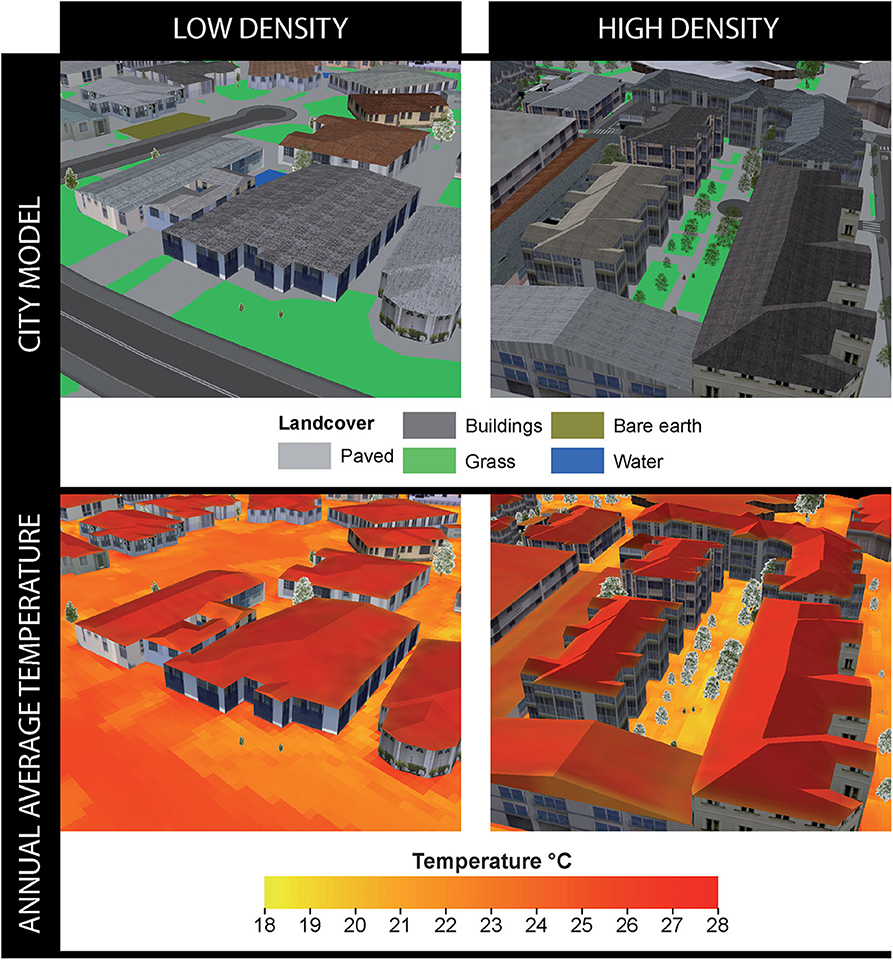
Scenarios
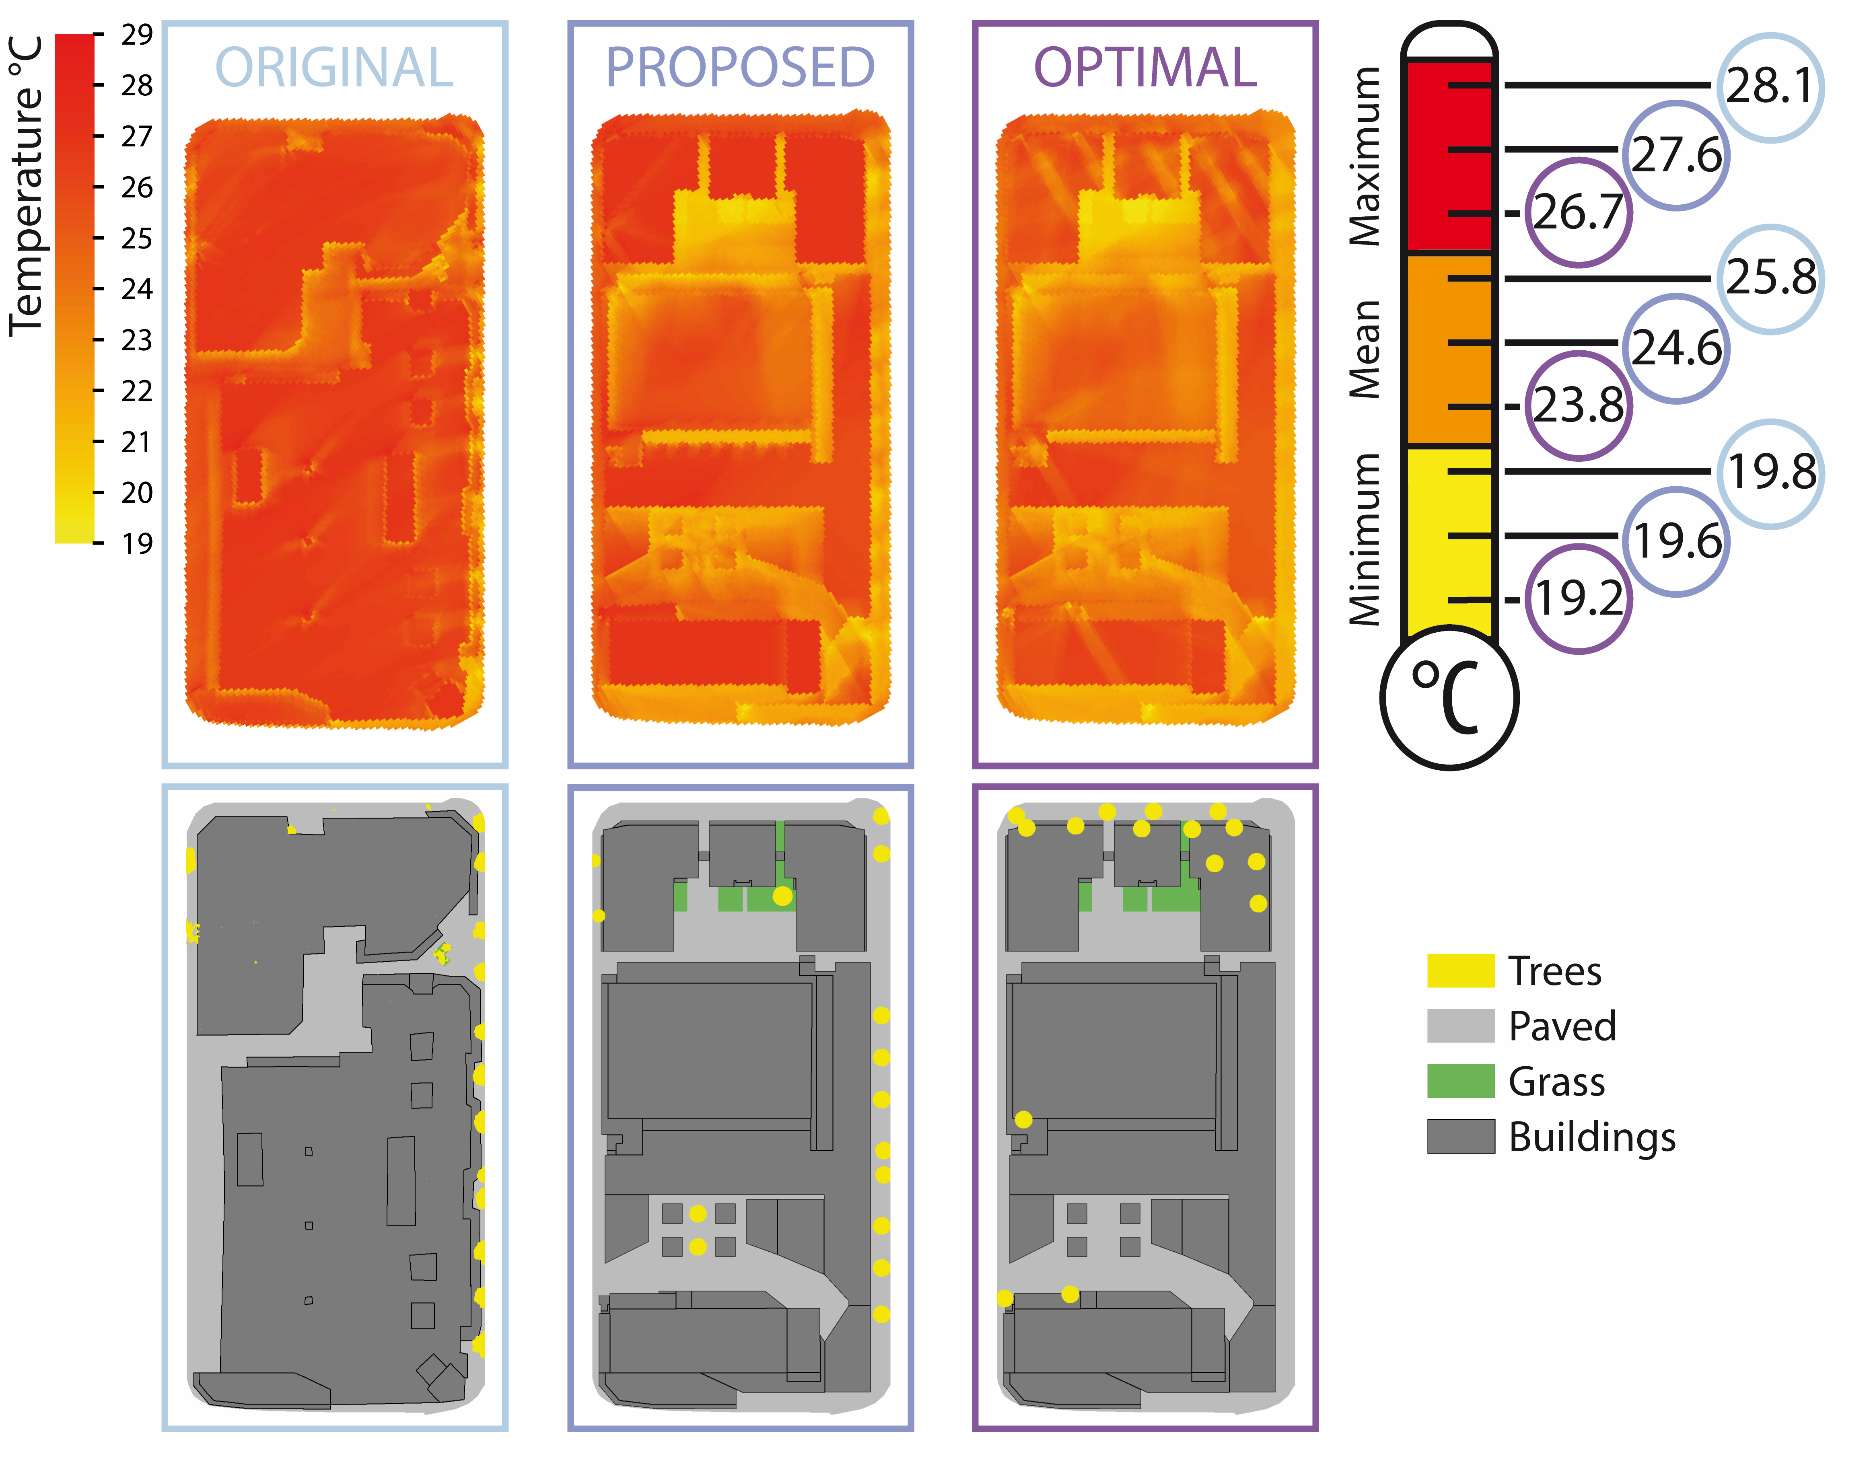
Ran 4 scenarios:
- Original (existing) development (from satellite imagery)
- Proposed redevelopment as in the plan
- Proposed redevelopment removing trees
- Proposed redevelopment with trees covering the hottest pixels
Policy
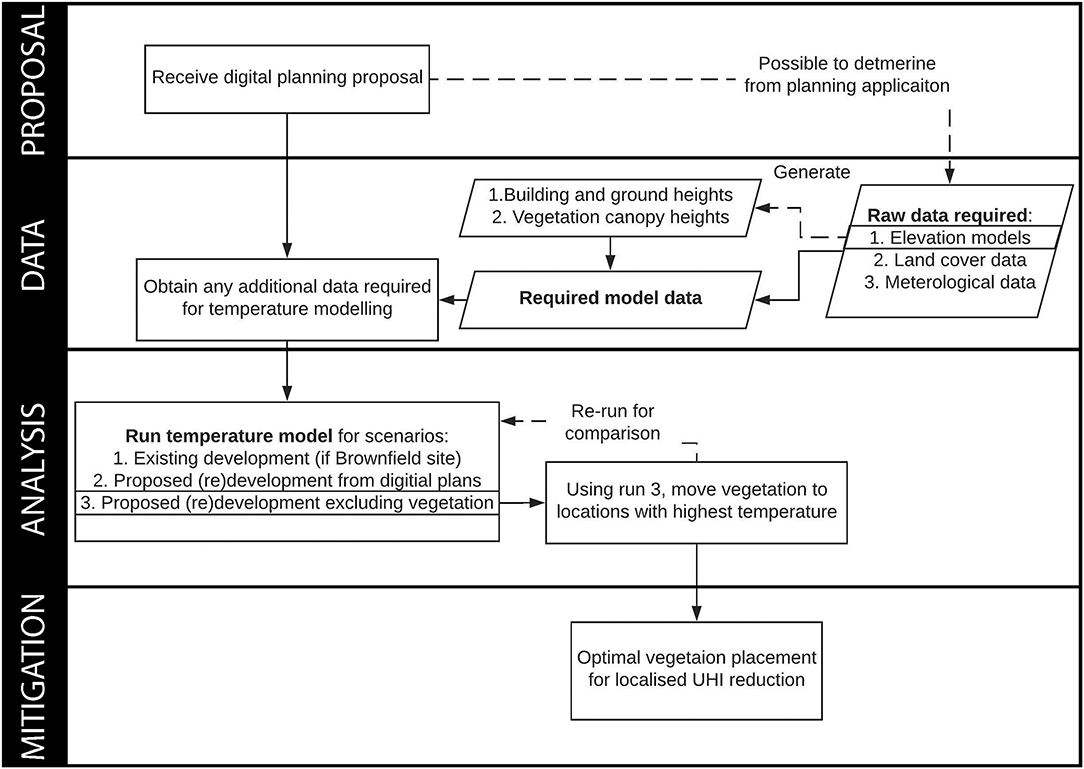
What can we do about it?
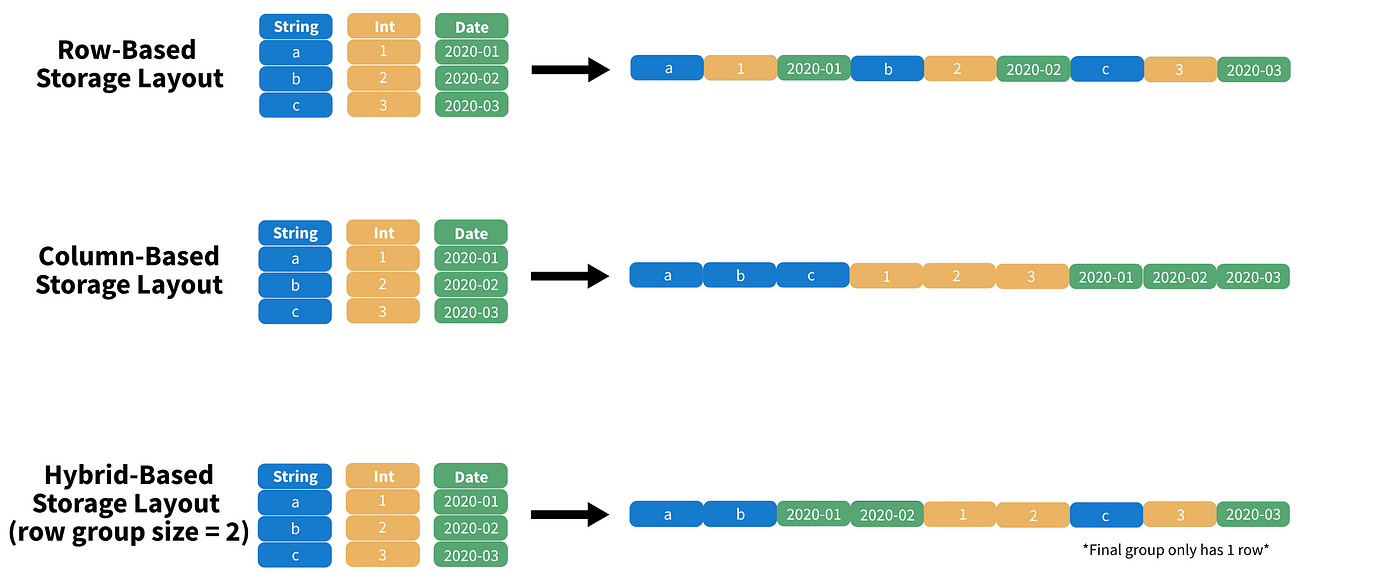
Parquet files
We are moving from row based storage to column based
About 50x faster than a .csv
It groups our data.
For example a row group size of 2, puts rows all the data from 1 and 2 next to each other then we have 3! = GROUPS or PARTITION
If we have large data this means we can skip groups we don’t need
![]()
We can go faster!

Postgres

Postgres = object-relational database
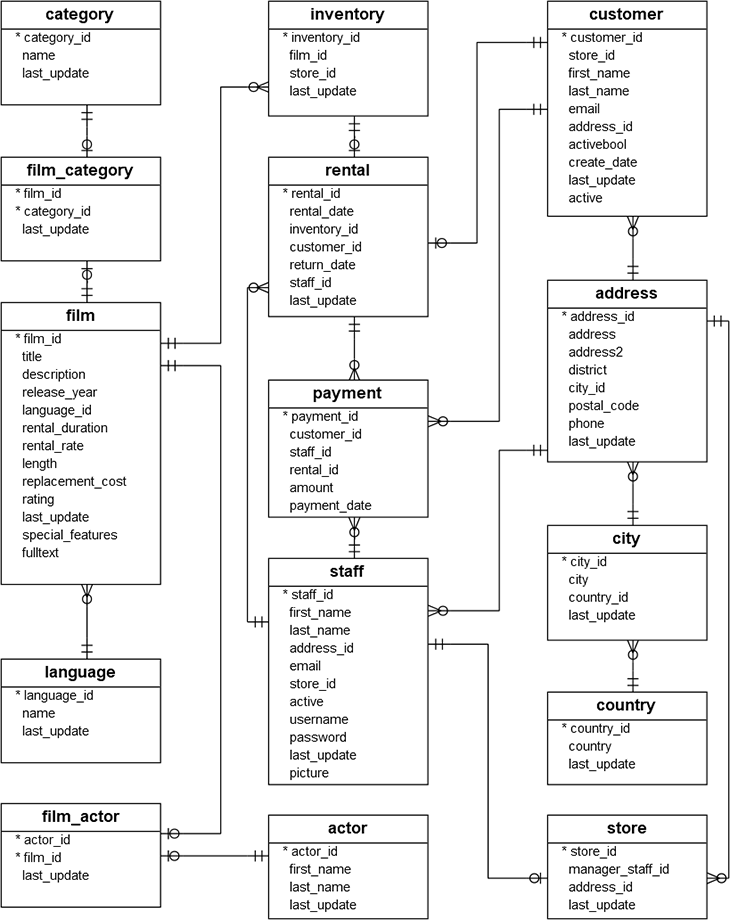
This allows the “geometry” column and spatial quieres
Making random points in polygons
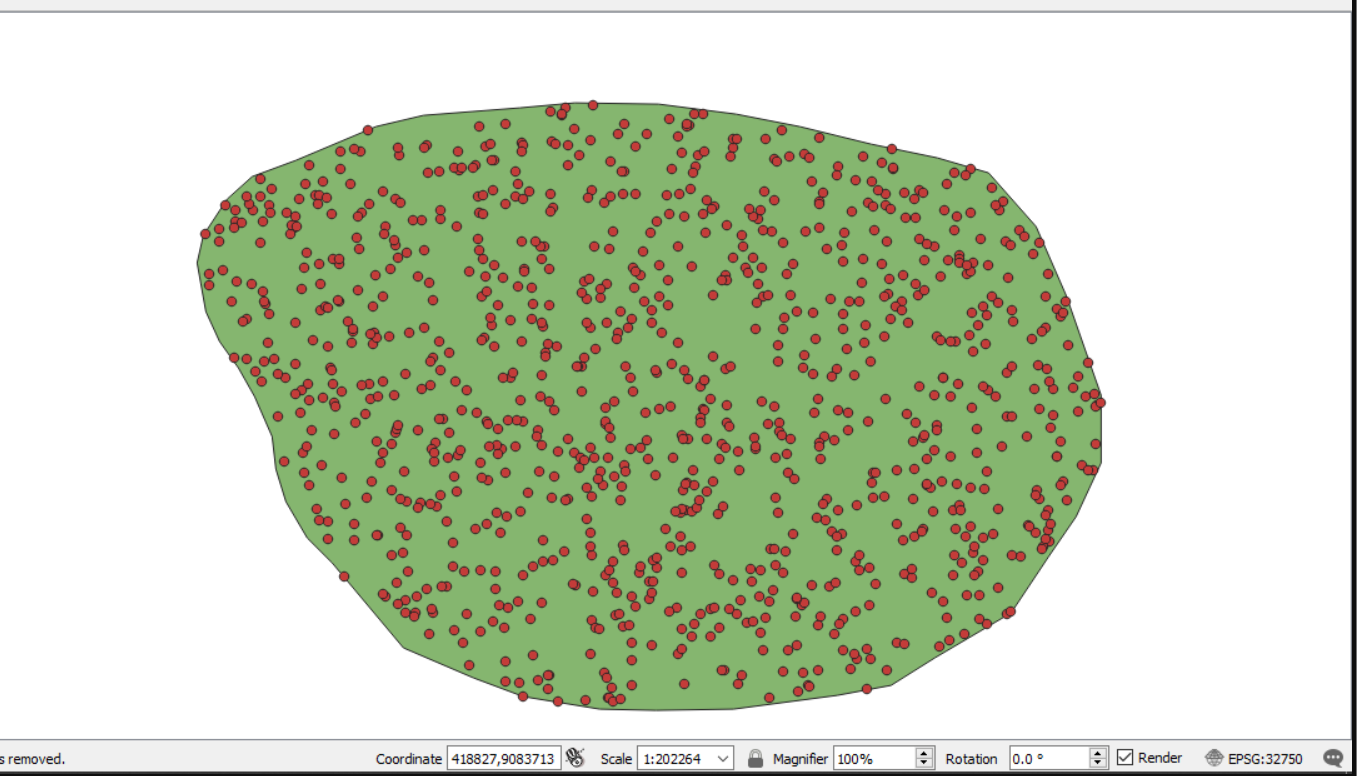
5 million random points
- QGIS = 226 seconds
- PostGIS = 18 seconds
PostGIS
![]()
Starting
Despite all these tools we must start with the basics.
Often this is in Quantum GIS (free) or ArcMap($)
Conclusion
It is essential to use data to inform decisions…BUT we must develop a critical awareness of:
- How the data has been created
- How the boundary data has been created
- What the agenda was for collecting the data
Almost any data can be spatial
We must recognize that:
- Data is a snapshot / sample of the population
- Analysis attempts to model the world - it is never perfect.
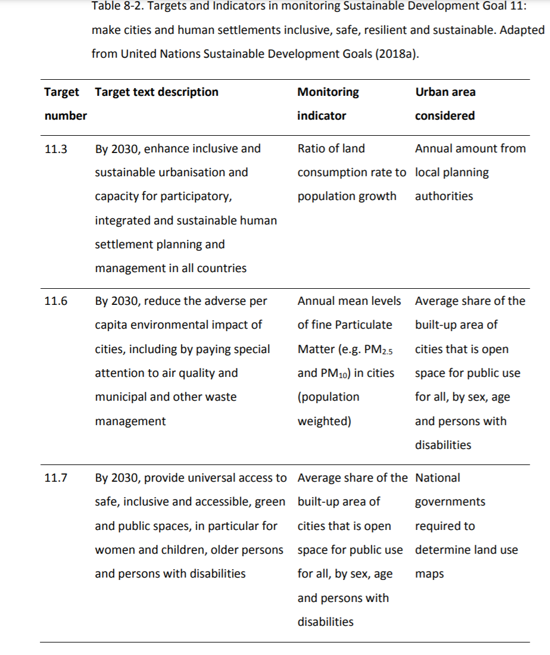
Scientists must have a say in the future of cities, McPhearson 2016
![]()